Telus 2011 Annual Report Download - page 64
Download and view the complete annual report
Please find page 64 of the 2011 Telus annual report below. You can navigate through the pages in the report by either clicking on the pages listed below, or by using the keyword search tool below to find specific information within the annual report.-
 1
1 -
2
-
3
-
4
-
5
-
6
-
7
-
8
-
9
-
10
-
11
-
12
-
13
-
14
-
15
-
16
-
17
-
18
-
19
-
20
-
21
-
22
-
23
-
24
-
25
-
26
-
27
-
28
-
29
-
30
-
31
-
32
-
33
-
34
-
35
-
36
-
37
-
38
-
39
-
40
-
41
-
42
-
43
-
44
-
45
-
46
-
47
-
48
-
49
-
50
-
51
-
52
-
53
-
 54
54 -
 55
55 -
 56
56 -
 57
57 -
 58
58 -
 59
59 -
 60
60 -
 61
61 -
 62
62 -
 63
63 -
 64
64 -
 65
65 -
 66
66 -
 67
67 -
 68
68 -
 69
69 -
 70
70 -
 71
71 -
 72
72 -
 73
73 -
 74
74 -
75
-
76
-
77
-
78
-
79
-
80
-
81
-
82
-
83
-
84
-
85
-
86
-
87
-
88
-
89
-
90
-
91
-
92
-
93
-
94
-
95
-
96
-
97
-
98
-
99
-
100
-
101
-
102
-
103
-
104
-
105
-
106
-
107
-
108
-
109
-
110
-
111
-
112
-
113
-
114
-
115
-
116
-
117
-
118
-
119
-
120
-
121
-
122
-
123
-
124
-
125
-
126
-
127
-
128
-
129
-
130
-
131
-
132
-
133
-
134
-
135
-
136
-
137
-
138
-
139
-
140
-
141
-
142
-
143
-
144
-
145
-
146
-
147
-
148
-
149
-
150
-
151
-
152
-
153
-
154
-
155
-
156
-
157
-
158
-
159
-
160
-
161
-
162
-
163
-
164
-
165
-
166
-
167
-
168
-
169
-
170
-
171
-
172
-
173
-
174
-
175
-
176
-
177
-
178
-
179
-
180
-
181
-
182
 |
 |

60 . TELUS 2011 ANNUAL REPORT
The trends in Net income and basic earnings per share (EPS) reflect the items noted above, as well as adjustments arising from legislated income
tax changes, settlements and tax reassessments for prior years, including any related interest on reassessments.
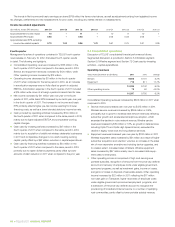
Income tax-related adjustments
($ in millions, except EPS amounts) 2011 Q4 2011 Q3 2011 Q2 2011 Q1 2010 Q4 2010 Q3 2010 Q2 2010 Q1
Approximate Net income impact 10 – 11 – 10 9 10 1
Approximate EPS impact 0.03 – 0.03 – 0.03 0.03 0.03 –
Approximate basic EPS excluding
income tax-related impacts 0.73 1.00 0.96 1.01 0.67 0.75 0.91 0.85
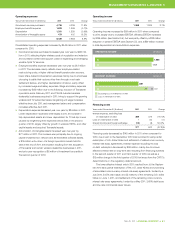
Fourth quarter
Management’s review of operations contained in TELUS’ fourth quarter
news release on February 10, 2012, discussed fourth quarter results
in detail. The following are highlights.
.Consolidated Operating revenues increased by $136 million in the
fourth quarter of 2011 when compared to the same period in 2010.
Service and equipment revenues increased by $120 million, while
Other operating income increased by $16 million.
.Operating income decreased by $3 million in the fourth quarter
of 2011 when compared to the same period in 2010, as an increase
in amortization expense was not fully offset by growth in adjusted
EBITDA. Amortization expense in the fourth quarter of 2011 included
a $19 million write-down of a foreign operation’s assets held for sale.
.Net income increased by $11 million year over year in the fourth
quar ter of 2011, while basic EPS increased by six cents year over year
in the fourth quarter of 2011. The increase in net income and basic
EPS primarily reflects higher pre-tax income resulting from lower
financing costs, as well as a lower blended statutory income tax rate.
.Cash provided by operating activities increased by $104 million in
the fourth quarter of 2011 when compared to the same period in 2010,
mainly due to higher adjusted EBITDA and comparative working
capital changes.
.Cash used by investing activities increased by $47 million in the
fourth quarter of 2011 when compared to the same period in 2010,
mainly due to acquisition of additional wireless dealership businesses
in 2011 and comparative changes in non-cash investing working
capital, partly offset by a $52 million reduction in capital expenditures.
.Cash used by financing activities increased by $34 million in the
fourth quarter of 2011 when compared to the same period in 2010,
primarily due to higher dividend payments partly offset by lower
amounts of debt reduction in 2011 when compared to the prior year.
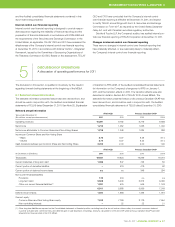
5.3 Consolidated operations
Discussion of TELUS’ consolidated financial performance follows.
Segmented discussion is provided in Section 5.4 Wireless segment,
Section 5.5 Wireline segment and Section 7.2 Cash used by investing
activities – capital expenditures.
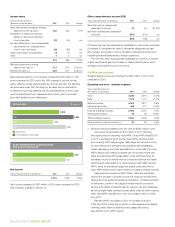
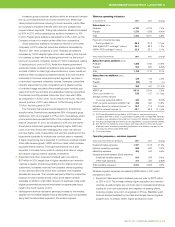
Operating revenues
Years ended December 31 ($ millions) 2 0 11 2010 Change
Service 9,606 9,131 5.2%
Equipment 719 611 17.7%
10,325 9,742 6.0%
Other operating income 72 50 44.0%
10,397 9,792 6.2%
Consolidated Operating revenues increased by $605 million in 2011 when
compared to 2010.
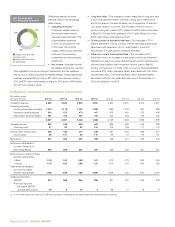
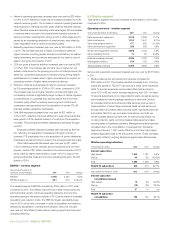
.Service revenues increased year over year by $475 million in 2011.
Wireless service revenues increased by $395 million or 8.5%,
prin cipally due to growth in wireless data network revenues reflecting
subscriber growth and accelerated smartphone adoption, which
exceeded the decline in voice network revenue. Wireline service
reve nues increased by $80 million or 1.8%, as growth in data services,
including Optik TV and Optik High Speed Internet, exceeded the
decline in legacy voice local and long distance services.
.Equipment revenues increased year over year by $108 million in 2011.
Wireless equipment sales increased by $51 million as a result of higher
subscriber acquisition and retention volumes, an increase in the sales
mix of more expensive smartphones including device upgrades, and
to a lesser extent, increased sales of tablets. Wireline equipment
sales increased by $57 million mainly due to increased data equip-
ment sales to enterprises.
.Other operating income is comprised of high cost serving area
portable subsidies, recognition of amounts from the price cap deferral
account and recovery of employee costs under eligible government-
sponsored programs, as well as investment gains, income or losses,
and gains or losses on disposal of real estate assets. Other operating
income increased by $22 million in 2011 reflecting the $17 million
non-cash gain on Transactel, higher recoveries of employee costs
under eligible government-sponsored employment programs, and
a drawdown of the price cap deferral account to recognize the
provisioning of broad band Internet service to a number of qualifying
rural commu nities, partly offset by lower portable subsidy revenue.