Telus 2011 Annual Report Download - page 106
Download and view the complete annual report
Please find page 106 of the 2011 Telus annual report below. You can navigate through the pages in the report by either clicking on the pages listed below, or by using the keyword search tool below to find specific information within the annual report.-
 1
1 -
2
-
3
-
4
-
5
-
6
-
7
-
8
-
9
-
10
-
11
-
12
-
13
-
14
-
15
-
16
-
17
-
18
-
19
-
20
-
21
-
22
-
23
-
24
-
25
-
26
-
27
-
28
-
29
-
30
-
31
-
32
-
33
-
34
-
35
-
36
-
37
-
38
-
39
-
40
-
41
-
42
-
43
-
44
-
45
-
46
-
47
-
48
-
49
-
50
-
51
-
52
-
53
-
54
-
55
-
56
-
57
-
58
-
59
-
60
-
61
-
62
-
63
-
64
-
65
-
66
-
67
-
68
-
69
-
70
-
71
-
72
-
73
-
74
-
75
-
76
-
77
-
78
-
79
-
80
-
81
-
82
-
83
-
84
-
85
-
86
-
87
-
88
-
89
-
90
-
91
-
92
-
93
-
94
-
95
-
 96
96 -
 97
97 -
 98
98 -
 99
99 -
 100
100 -
 101
101 -
 102
102 -
 103
103 -
 104
104 -
 105
105 -
 106
106 -
 107
107 -
 108
108 -
 109
109 -
 110
110 -
 111
111 -
 112
112 -
 113
113 -
 114
114 -
 115
115 -
 116
116 -
117
-
118
-
119
-
120
-
121
-
122
-
123
-
124
-
125
-
126
-
127
-
128
-
129
-
130
-
131
-
132
-
133
-
134
-
135
-
136
-
137
-
138
-
139
-
140
-
141
-
142
-
143
-
144
-
145
-
146
-
147
-
148
-
149
-
150
-
151
-
152
-
153
-
154
-
155
-
156
-
157
-
158
-
159
-
160
-
161
-
162
-
163
-
164
-
165
-
166
-
167
-
168
-
169
-
170
-
171
-
172
-
173
-
174
-
175
-
176
-
177
-
178
-
179
-
180
-
181
-
182
 |
 |

10 2 . TELUS 2011 ANNUAL REPORT
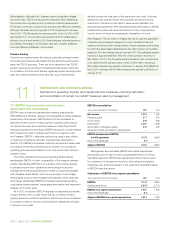
More representative of a sustainable calculation is the historical ratio
based on reported earnings per share adjusted to exclude income tax-
related adjustments, losses on redemption of long-term debt, ongoing
impacts of a net-cash settlement feature introduced in 2007, and items
adjusted for in EBITDA.
Calculation of Dividend payout ratios
Years ended December 31 ($) 2 0 11 2010
Dividend payout ratio
Numerator – Annualized fourth quarter
dividend declared per Common Share
and Non-Voting Share 2.32 2.10
Denominator – Income per Common Share
and Non-Voting Share 3.76 3.27
Ratio (%) 62 64
Dividend payout ratio of adjusted net earnings
Numerator (from above) 2.32 2.10
Adjusted net earnings ($ millions)
Net income attributable to Common Shares
and Non-Voting Shares 1,219 1,048
Deduct favourable income tax-related
adjustments (21) (30)
Add back loss on redemption of debt – 37
Deduct after-tax Transactel gain (12) –
Net-cash settlement feature (14) (7)
1,172 1,048
Denominator – Adjusted net earnings per
Common Share and Non-Voting Share 3.61 3.27
Adjusted ratio (%) 64 64
EBITDA – excluding restructuring costs is defined as EBITDA
(see Section 11.1), adding back restructuring costs of $35 million for
the
year ended December 31, 2011, and $80 million for the year ended
December 31, 2010. This measure is used in the calculation of Net
debt to EBITDA – excluding restructuring costs and EBITDA – excluding
restructuring costs interest coverage, consistent with the calculation
of the Leverage Ratio and the Coverage Ratio in credit facility covenants.
EBITDA – excluding restructuring costs interest coverage is defined
as EBITDA excluding restructuring costs, divided by Net interest cost,
calculated on a 12-month trailing basis. This measure is substantially the
same as the Coverage Ratio covenant in TELUS’ credit facilities.
Net debt: The nearest IFRS measure is Long-term debt, including Current
maturities of long-term debt, as reconciled below. Net debt is a compo-
nent of a ratio used to determine compliance with debt covenants (refer
to the description of Net debt to EBITDA below). Management believes
that Net debt is a useful measure because it represents the amount
of long-term debt obligations that are not covered by available cash and
temporary investments, and because it incorporates any exchange rate
impact of cross currency swap agreements put into place to fix the value
of U.S. dollar debt.
Calculation of Net debt
At December 31 ($ millions) 2 0 11 2010
Long-term debt including current portion 6,574 6,056
Debt issuance costs netted against long-term debt 27 28
Derivative liability(1) – 404
Accumulated other comprehensive income amounts
arising from financial instruments used to manage
interest rate and currency risks associated with
U.S. dollar denominated debt (excluding tax effects)
– (2)
Cash and temporary investments (46) (17)
Short-term borrowings 404 400
Net debt 6,959 6,869
(1) The derivative liability at December 31, 2010, was in respect of the U.S.$741 million
debenture that matured on June 1, 2011, and related to cross currency interest
rate swap agreements that effectively converted principal repayments and interest
obligations to Canadian dollar obligations.
Net debt to EBITDA – excluding restructuring costs is defined as
Net debt at the end of the period divided by the 12-month trailing EBITDA
– excluding restructuring costs. TELUS’ long-term guideline range for
Net debt to EBITDA is from 1.5 to 2.0 times. This measure is substantially
the same as the Leverage Ratio covenant in TELUS’ credit facilities.
Net debt to total capitalization provides a measure of the proportion
of debt used in the Company’s capital structure.
Net interest cost is defined as Financing costs before gains on
redemp tion and repayment of debt, calculated on a 12-month trailing
basis. No gains on redemption and repayment of debt were recorded
in the respective periods. Losses recorded on the redemption of debt
are included in net interest cost. Net interest costs for the years ended
December 31, 2011 and 2010, are equal to reported Financing costs.
Total capitalization – book value is calculated as Net debt, defined
above, plus Owners’ equity excluding accumulated other comprehensive
income or loss. The calculation for December 31, 2010, has been
adjusted for a retrospective reclassification of post-changeover employee
defined benefit plans actuarial gains (losses) from Accumulated other
comprehensive income to Retained earnings.
Calculation of total capitalization
At December 31 ($ millions) 2 0 11 2010
Net debt 6,959 6,869
Owners’ equity 7,513 7,781
Add back (deduct) Accumulated
other comprehensive loss (income) (11) (1)
Total capitalization – book value 14,461 14,649