Telus 2011 Annual Report Download - page 124
Download and view the complete annual report
Please find page 124 of the 2011 Telus annual report below. You can navigate through the pages in the report by either clicking on the pages listed below, or by using the keyword search tool below to find specific information within the annual report.-
 1
1 -
2
-
3
-
4
-
5
-
6
-
7
-
8
-
9
-
10
-
11
-
12
-
13
-
14
-
15
-
16
-
17
-
18
-
19
-
20
-
21
-
22
-
23
-
24
-
25
-
26
-
27
-
28
-
29
-
30
-
31
-
32
-
33
-
34
-
35
-
36
-
37
-
38
-
39
-
40
-
41
-
42
-
43
-
44
-
45
-
46
-
47
-
48
-
49
-
50
-
51
-
52
-
53
-
54
-
55
-
56
-
57
-
58
-
59
-
60
-
61
-
62
-
63
-
64
-
65
-
66
-
67
-
68
-
69
-
70
-
71
-
72
-
73
-
74
-
75
-
76
-
77
-
78
-
79
-
80
-
81
-
82
-
83
-
84
-
85
-
86
-
87
-
88
-
89
-
90
-
91
-
92
-
93
-
94
-
95
-
96
-
97
-
98
-
99
-
100
-
101
-
102
-
103
-
104
-
105
-
106
-
107
-
108
-
109
-
110
-
111
-
112
-
113
-
 114
114 -
 115
115 -
 116
116 -
 117
117 -
 118
118 -
 119
119 -
 120
120 -
 121
121 -
 122
122 -
 123
123 -
 124
124 -
 125
125 -
 126
126 -
 127
127 -
 128
128 -
 129
129 -
 130
130 -
 131
131 -
 132
132 -
 133
133 -
 134
134 -
135
-
136
-
137
-
138
-
139
-
140
-
141
-
142
-
143
-
144
-
145
-
146
-
147
-
148
-
149
-
150
-
151
-
152
-
153
-
154
-
155
-
156
-
157
-
158
-
159
-
160
-
161
-
162
-
163
-
164
-
165
-
166
-
167
-
168
-
169
-
170
-
171
-
172
-
173
-
174
-
175
-
176
-
177
-
178
-
179
-
180
-
181
-
182
 |
 |

120 . TELUS 2011 ANNUAL REPORT
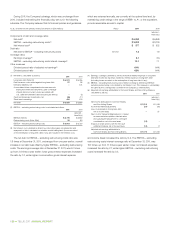
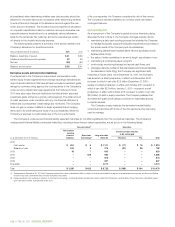
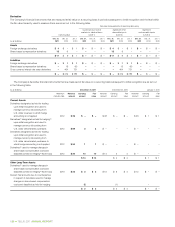
During 2011, the Company’s strategy, which was unchanged from
2010, included maintaining the financial policy set out in the following
schedule. The Company believes that its financial policies and guidelines,
which are reviewed annually, are currently at the optimal level and, by
maintaining credit ratings in the range of BBB+ to A–, or the equivalent,
provide reasonable access to capital.
As at, or twelve-month periods ended, December 31 ($ in millions) Policy 2 0 11 2010
(adjusted –
Note 25(c))
Components of debt and coverage ratios
Net debt(1) $ß6,959 $ß6,869
EBITDA – excluding restructuring costs(2) $ß3,813 $ß3,730
Net interest cost(3) $ 377 $ 522
Debt ratio
Net debt to EBITDA – excluding restructuring costs 1.5–2.0 1.8 1.8
Coverage ratios
Earnings coverage(4) 5.1 3.6
EBITDA – excluding restructuring costs interest coverage(5) 10.1 7.1
Other measures
Dividend payout ratio of adjusted net earnings(6) 64% 64%
Dividend payout ratio 62% 64%
(1) Net debt is calculated as follows:
2 0 11 2010
Long-term debt (Note 20) $ß6,574 $ß6,056
Debt issuance costs netted against long-term debt 27 28
Derivative liabilities, net – 404
Accumulated other comprehensive income amounts
arising from financial instruments used to manage
interest rate and currency risks associated with
U.S. dollar denominated debt (excluding tax effects) – (2)
Cash and temporary investments, net (46) (17)
Short-term borrowings 404 400
Net debt $ß6,959 $ß6,869
(2) EBITDA – excluding restructuring costs is calculated as follows:
2 0 11 2010
(adjusted –
Note 25(c))
EBITDA (Note 5) $ß3,778 $ß3,650
Restructuring costs (Note 19(b)) 35 80
EBITDA – excluding restructuring costs $ß3,813 $ß3,730
(3) Net interest cost is defined as financing costs before gains on redemption and
repayment of debt, calculated on a twelve-month trailing basis (losses recorded
on the redemption of long-term debt, if any, are included in net interest cost).
(4) Earnings coverage is defined as net income before interest expense on long-term
debt and income tax expense, divided by interest expense on long-term debt
(including losses recorded on the redemption of long-term debt, if any).
(5) EBITDA – excluding restructuring costs interest coverage is defined as EBITDA –
excluding restructuring costs divided by net interest cost. This measure is substantially
the same as the coverage ratio covenant in the Company’s credit facilities.
(6) Adjusted net earnings attributable to Common Shares and Non-Voting Shares is
calculated as follows:
2 0 11 2010
(adjusted –
Note 25(c))
Net income attributable to Common Shares
and Non-Voting Shares $ß1,219 $ß1,048
Income tax-related adjustments (21) (30)
Loss on redemption of long-term debt,
net of income taxes – 37
Gain on 51% Transactel (Barbados) Inc. interest
re-measured at acquisition-date fair value
and subsequent adjustment to contingent
consideration, net of income taxes (12) –
Impacts of share options with the net-cash
settlement feature, net of income taxes (14) (7)
Adjusted net earnings attributable to
Common Shares and Non-Voting Shares $ß1,172 $ß1,048
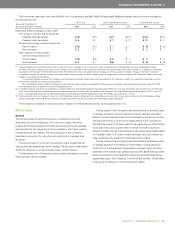
The net debt to EBITDA – excluding restructuring costs ratio was
1.8 times at December 31, 2011, unchanged from one year earlier; a small
increase in net debt was offset by higher EBITDA – excluding restructuring
costs. The earnings coverage ratio at December 31, 2011, was 5.1 times,
up from 3.6 times a year earlier; lower gross interest expenses increased
the ratio by 1.3, while higher income before gross interest expense
and income taxes increased the ratio by 0.2. The EBITDA – excluding
restructuring costs interest coverage ratio at December 31, 2011, was
10.1 times, up from 7.1 times a year earlier; lower net interest expenses
increased the ratio by 2.7, while higher EBITDA – excluding restructuring
costs increased the ratio by 0.3.