Telus 2011 Annual Report Download - page 63
Download and view the complete annual report
Please find page 63 of the 2011 Telus annual report below. You can navigate through the pages in the report by either clicking on the pages listed below, or by using the keyword search tool below to find specific information within the annual report.-
 1
1 -
2
-
3
-
4
-
5
-
6
-
7
-
8
-
9
-
10
-
11
-
12
-
13
-
14
-
15
-
16
-
17
-
18
-
19
-
20
-
21
-
22
-
23
-
24
-
25
-
26
-
27
-
28
-
29
-
30
-
31
-
32
-
33
-
34
-
35
-
36
-
37
-
38
-
39
-
40
-
41
-
42
-
43
-
44
-
45
-
46
-
47
-
48
-
49
-
50
-
51
-
52
-
 53
53 -
 54
54 -
 55
55 -
 56
56 -
 57
57 -
 58
58 -
 59
59 -
 60
60 -
 61
61 -
 62
62 -
 63
63 -
 64
64 -
 65
65 -
 66
66 -
 67
67 -
 68
68 -
 69
69 -
 70
70 -
 71
71 -
 72
72 -
 73
73 -
74
-
75
-
76
-
77
-
78
-
79
-
80
-
81
-
82
-
83
-
84
-
85
-
86
-
87
-
88
-
89
-
90
-
91
-
92
-
93
-
94
-
95
-
96
-
97
-
98
-
99
-
100
-
101
-
102
-
103
-
104
-
105
-
106
-
107
-
108
-
109
-
110
-
111
-
112
-
113
-
114
-
115
-
116
-
117
-
118
-
119
-
120
-
121
-
122
-
123
-
124
-
125
-
126
-
127
-
128
-
129
-
130
-
131
-
132
-
133
-
134
-
135
-
136
-
137
-
138
-
139
-
140
-
141
-
142
-
143
-
144
-
145
-
146
-
147
-
148
-
149
-
150
-
151
-
152
-
153
-
154
-
155
-
156
-
157
-
158
-
159
-
160
-
161
-
162
-
163
-
164
-
165
-
166
-
167
-
168
-
169
-
170
-
171
-
172
-
173
-
174
-
175
-
176
-
177
-
178
-
179
-
180
-
181
-
182
 |
 |

TELUS 2011 ANNUAL REPORT . 59
MANAGEMENT’S DISCUSSION & ANALYSIS: 5
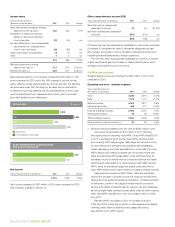
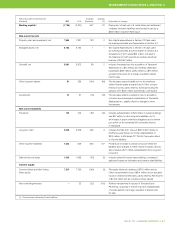
Trends
The consolidated revenue trend principally reflects: (i) year-over-year
growth in wireless network revenues generated from a growing subscriber
base and increasing ARPU; (ii) increased wireless equipment revenues;
and (iii) growth in wireline data revenues, which now more than offsets
declining legacy wireline voice and other service and equipment revenues.
Beginning in 2011, newly consolidated Transactel operations and acquired
wireless dealership businesses added revenue of $13 million, $13 million,
$13 million and $11 million, respectively, in the fourth, third, second and
first quarters, while impacts to Net income were insignificant.
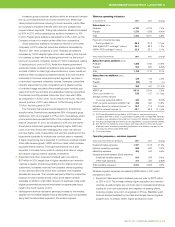
Wireless network revenue reflects growing data revenue (47% growth
in 2011), partly offset by declining voice revenue (a 4.1% decrease in
2011). Data growth reflects increased use of data plans and growth
in data consumption driven by increasing smartphone adoption, as well
as increased roaming revenues. The growing demand for wireless data
may challenge network and spectrum capacity in the future. Year-
over-year growth rates for data ARPU were 35%, 44%, 39% and 35%,
respectively, in the fourth, third, second and first quarters of 2011, and
27%, 21%, 19% and 17%, respectively, for the fourth, third, second
and first quarters of 2010. Recent moderation in the data ARPU growth
trend is a result of competitive pressures on data driving bigger included-
data buckets in rate plans, and an increasing number of unlimited
messaging rate plans, as well as a jump in smartphone adoption and
corresponding increase in usage in the latter part of 2010. Decreasing
voice revenues reflect accelerating declines in voice ARPU, which
decreased year over year in 2011 by 12%, 10%, 9.3% and 5.8%, respec-
tively, for the fourth, third, second and first quarters of 2011. This
reversed
an improving trend in 2010, where year-over-year declines in voice ARPU
were 5.2%, 6.7%, 7.2% and 9.5%, respectively, for the fourth, third, second
and first quarters of 2010. Blended ARPU has increased
year over year
for five consecutive quarters, at 1.0%, 3.0%, 2.5%, 3.7%
and 1.9%,
respectively, for the fourth, third, second and first quarters
of 2011 and
the fourth quarter of 2010, following several years of declines.
Wireless equipment revenues have generally increased year over year
due to higher subscriber acquisition volumes, higher retention volumes
and device upgrade revenues, as well as an increasing proportion of more
expensive smartphones in the sales mix.
There is significant third and fourth quarter seasonality with respect
to higher wireless subscriber additions, related acquisition costs and
equipment sales, and higher retention costs due to contract renewals.
Wireless EBITDA typically decreases in the fourth quarter as a result
of heightened competitive intensity. Subscriber additions have typically
been lowest in the first quarter. In addition, wireless ARPU has generally
risen sequentially in the second and third quarters, and declined
sequentially in the fourth and first quarters.
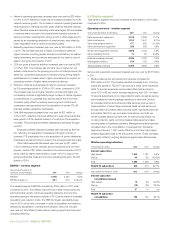
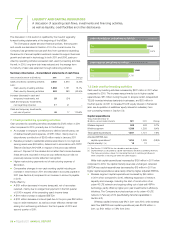
The positive wireline revenue trend reflects data revenue growth
resulting from continuing expansion of the TELUS TV subscriber base
(up 62% in 2011) and price increases, as well as growth in enhanced
data, Internet and managed workplace revenues, moderated by ongoing
declines in legacy basic data services. Growth in Internet revenues
includes expansion of the Optik High Speed Internet subscriber base
as a result of bundled offers with Optik TV, as well as rate increases.
A general trend of declining wireline voice revenues and network access
lines (NALs) is due to substitution to wireless and IP-based services,
as well as competition from VoIP service providers (including cable-TV
competitors), resellers and facilities-based competitors. Residential NAL
losses have moderated over the most recent six quarters – positively
impacted by Optik TV and Optik High Speed Internet services and
improved bundled service offers. While business NALs reflected year-
over-year growth in the first two quarters of 2011 due to implementation
of whole sale services, the general trend, as reflected in the third and
fourth quar ters of 2011, is a decline in business NALs due to increased
compe tition in the SMB market, as well as conversion of voice lines to
more efficient IP-based services. The primary cable-TV competitor in
Western Canada increased its promotional activity and incentives to win
back and protect its subscriber base in 2011, which could affect Optik
growth, NAL erosion rates, and costs of acquisition and retention in future.
A sequential increase in residential NAL losses in the fourth quarter of
2011 was due to this increased promotional activity.
The trend in the Goods and services purchased expense reflects
increasing content and support costs for the growing TELUS Optik TV
subscriber base, increased costs of acquisition and retention for wireless
subscribers, as well as fourth quarter wireless expense seasonality
described above.
Employee benefits expense starting in the second quarter of 2011
reflects increases in full-time equivalent (FTE) staff resulting from the
acqui sition of Transactel and wireless dealership businesses, as well as
targeted hiring to support TV, business and wireless growth, partly offset
by lower employee-related restructuring costs and lower defined benefit
plan expenses. Employee benefits expenses in 2010 reflected decreasing
domestic FTE staff as a result of efficiency initiatives and attrition, partly
offset by compensation increases and increasing international FTE staff
to provide services for business customers and for internal purposes.
The sequential increase in depreciation and amortization expense in
the fourth quarter of 2011 resulted from a $19 million write-down of assets
in a foreign operation that were held for sale at December 31, 2011, as
well as an increase in capital assets to facilitate subscriber growth. The
sequential decrease in depreciation and amortization expenses in the
second quarter of 2010 included a reduced depreciation run rate for TV
set-top boxes resulting from an increase in their estimated useful lives,
and the effect of reduced capital expenditures in the first half of 2010.
Amortization expense in the second quarter of 2010 included a reduction
of approximately $5 million resulting from the recognition of investment
tax credits following determination of eligibility by taxation authorities for
assets capitalized in prior years that were fully amortized.
Financing costs for each period shown are net of varying amounts
of interest income, including interest from the settlement of prior years’
income tax-related matters. Quarterly financing costs in 2011 were lower
than in the same periods in 2010 mainly due to lower effective interest
rates as a result of refinancing activities in 2010 and 2011, as well as
the absence of an early redemption charge in 2011. Financing costs
in the third quarter of 2010 included a $15 million charge in respect of
final deter minations for the regulatory deferral account, as well as a
$52 million loss on early redemption of approximately 45% of the then
outstanding principal amount of 8% U.S. dollar Notes and unwinding
of related cross currency interest rate swap agreements. The partial
redemption was financed with a new lower-cost 10-year, $1 billion 5.05%
Note issue.