Telus 2011 Annual Report Download - page 38
Download and view the complete annual report
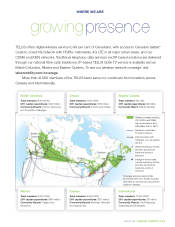
Please find page 38 of the 2011 Telus annual report below. You can navigate through the pages in the report by either clicking on the pages listed below, or by using the keyword search tool below to find specific information within the annual report.-
 1
1 -
2
-
3
-
4
-
5
-
6
-
7
-
8
-
9
-
10
-
11
-
12
-
13
-
14
-
15
-
16
-
17
-
18
-
19
-
20
-
21
-
22
-
23
-
24
-
25
-
26
-
27
-
 28
28 -
 29
29 -
 30
30 -
 31
31 -
 32
32 -
 33
33 -
 34
34 -
 35
35 -
 36
36 -
 37
37 -
 38
38 -
 39
39 -
 40
40 -
 41
41 -
 42
42 -
 43
43 -
 44
44 -
 45
45 -
 46
46 -
 47
47 -
 48
48 -
49
-
50
-
51
-
52
-
53
-
54
-
55
-
56
-
57
-
58
-
59
-
60
-
61
-
62
-
63
-
64
-
65
-
66
-
67
-
68
-
69
-
70
-
71
-
72
-
73
-
74
-
75
-
76
-
77
-
78
-
79
-
80
-
81
-
82
-
83
-
84
-
85
-
86
-
87
-
88
-
89
-
90
-
91
-
92
-
93
-
94
-
95
-
96
-
97
-
98
-
99
-
100
-
101
-
102
-
103
-
104
-
105
-
106
-
107
-
108
-
109
-
110
-
111
-
112
-
113
-
114
-
115
-
116
-
117
-
118
-
119
-
120
-
121
-
122
-
123
-
124
-
125
-
126
-
127
-
128
-
129
-
130
-
131
-
132
-
133
-
134
-
135
-
136
-
137
-
138
-
139
-
140
-
141
-
142
-
143
-
144
-
145
-
146
-
147
-
148
-
149
-
150
-
151
-
152
-
153
-
154
-
155
-
156
-
157
-
158
-
159
-
160
-
161
-
162
-
163
-
164
-
165
-
166
-
167
-
168
-
169
-
170
-
171
-
172
-
173
-
174
-
175
-
176
-
177
-
178
-
179
-
180
-
181
-
182
 |
 |
34 . TELUS 2011 ANNUAL REPORT
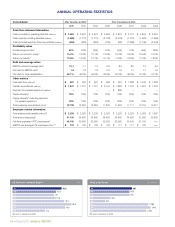
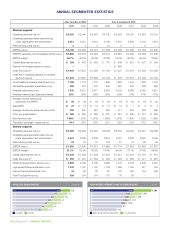
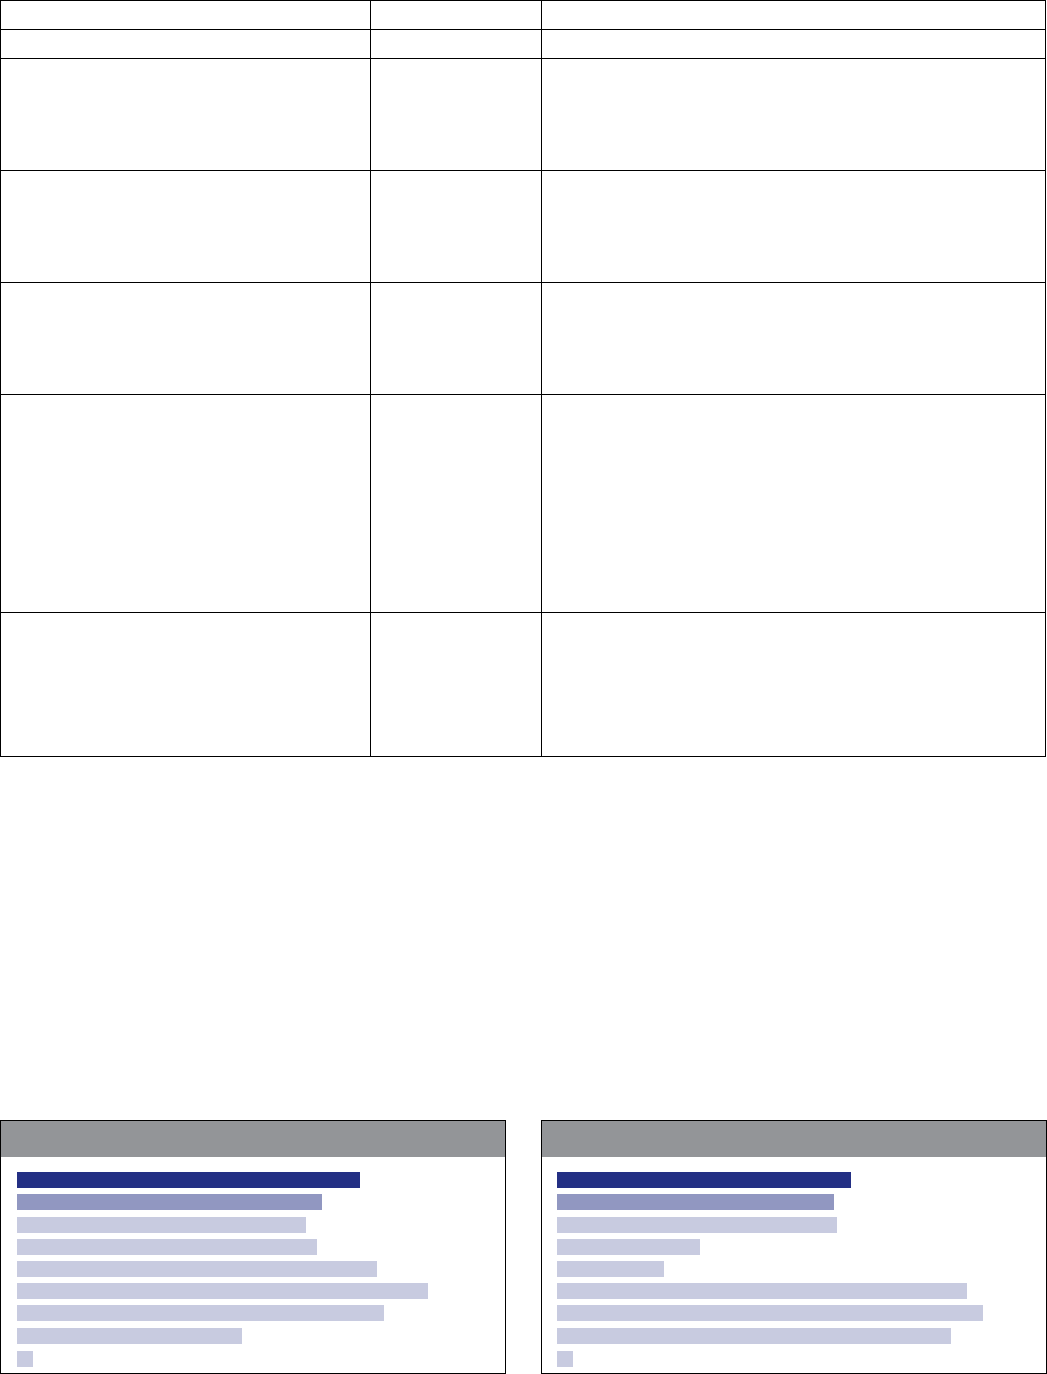
13.8
15.5
16.6
10.2
16.3
18.6
13.6
13.1
RETURN ON COMMON EQUITY (%)
11
10
10
09
08
07
06
05
prior to transition to IFRS
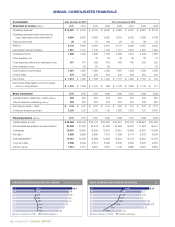
ANNUAL OPERATING STATISTICS
Consolidated After transition to IFRS1 Prior to transition to IFRS
2 0 11 2010 2010 2009 2008 2007 2006 2005
Cash flow statement information
Cash provided by operating activities (millions)
$ß 2,550 $ß 2,670 $ß 2,570 $ß 2,904 $ß 2,819 $ß 3,172 $ß 2,804 $ß 2,915
Cash used by investing activities (millions)
(1,968) (1,731) (1,731) (2,128) (3,433) (1,772) (1,675) (1,355)
Cash provided (used) by financing activities (millions)
(553) (963) (863) (739) 598 (1,369) (1,149) (2,448)
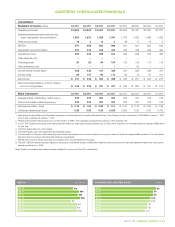
Profitability ratios
Dividend payout ratio2 62% 64% 65% 61% 54% 47% 45% 55%
Return on common equity3 15.5% 13.8% 13.1% 13.6% 16.3% 18.6% 16.6% 10.2%
Return on assets4 12.8% 13.6% 13.1% 15.1% 14.8% 18.8% 17.0% 18.0%
Debt and coverage ratios
EBITDA interest coverage ratio5 10.1 7.1 7.3 6.9 8.3 8.2 7.3 5.4
Net debt to EBITDA ratio6 1.8 1.8 1.8 2.0 1.9 1.7 1.7 1.9
Net debt to total capitalization 48.1% 46.9% 45.5% 48.9% 50.2% 46.9% 47.4% 47.7%
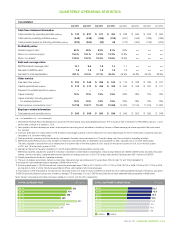
Other metrics
Free cash flow (millions)7 $ 997 $ 939 $ 947 $ 485 $ 361 $ß 1,388 $ß 1,443 $ß 1,336
Capital expenditures (millions) $ß 1,847 $ß 1,721 $ß 1,721 $ß 2,103 $ß 1,859 $ß 1,770 $ß 1,618 $ß 1,319
Payment for wireless spectrum (millions) – – – – $ 882 – – –
Capex intensity8 18% 18% 18% 22% 19% 20% 19% 16%
Capex intensity8 including payment
for wireless spectrum 18% 18% 18% 22% 28% 20% 19% 16%
Total customer connections (000s)9 12,728 12,253 12,253 11,875 11,603 11,111 10,715 10,211
Employee-related information
Total salaries and benefits (millions)10 $ß 2,258 $ß 2,205 $ß 2,233 $ß 2,303 $ß 2,326 $ß 2,329 $ß 2,028 $ß 1,897
Total active employees11 41,100 34,800 34,800 36,400 36,600 34,200 31,900 29,800
Full-time equivalent (FTE) employees12 40,100 33,900 33,900 35,300 35,900 33,400 31,100 n.m.
EBITDA per average FTE employee (000s)1 2 ,13 $ 102 $ 109 $ 109 $ 106 $ 111 $ 117 $ 126 n.m.
939
997
1,443
1, 336
361
1, 388
485
947
FREE CASH FLOW ($ millions)
11
10
10
09
08
07
06
05
prior to transition to IFRS