Duke Energy 2013 Annual Report Download - page 89
Download and view the complete annual report
Please find page 89 of the 2013 Duke Energy annual report below. You can navigate through the pages in the report by either clicking on the pages listed below, or by using the keyword search tool below to find specific information within the annual report.-
 1
1 -
2
-
3
-
4
-
5
-
6
-
7
-
8
-
9
-
10
-
11
-
12
-
13
-
14
-
15
-
16
-
17
-
18
-
19
-
20
-
21
-
22
-
23
-
24
-
25
-
26
-
27
-
28
-
29
-
30
-
31
-
32
-
33
-
34
-
35
-
36
-
37
-
38
-
39
-
40
-
41
-
42
-
43
-
44
-
45
-
46
-
47
-
48
-
49
-
50
-
51
-
52
-
53
-
54
-
55
-
56
-
57
-
58
-
59
-
60
-
61
-
62
-
63
-
64
-
65
-
66
-
67
-
68
-
69
-
70
-
71
-
72
-
73
-
74
-
75
-
76
-
77
-
78
-
 79
79 -
 80
80 -
 81
81 -
 82
82 -
 83
83 -
 84
84 -
 85
85 -
 86
86 -
 87
87 -
 88
88 -
 89
89 -
 90
90 -
 91
91 -
 92
92 -
 93
93 -
 94
94 -
 95
95 -
 96
96 -
 97
97 -
 98
98 -
 99
99 -
100
-
101
-
102
-
103
-
104
-
105
-
106
-
107
-
108
-
109
-
110
-
111
-
112
-
113
-
114
-
115
-
116
-
117
-
118
-
119
-
120
-
121
-
122
-
123
-
124
-
125
-
126
-
127
-
128
-
129
-
130
-
131
-
132
-
133
-
134
-
135
-
136
-
137
-
138
-
139
-
140
-
141
-
142
-
143
-
144
-
145
-
146
-
147
-
148
-
149
-
150
-
151
-
152
-
153
-
154
-
155
-
156
-
157
-
158
-
159
-
160
-
161
-
162
-
163
-
164
-
165
-
166
-
167
-
168
-
169
-
170
-
171
-
172
-
173
-
174
-
175
-
176
-
177
-
178
-
179
-
180
-
181
-
182
-
183
-
184
-
185
-
186
-
187
-
188
-
189
-
190
-
191
-
192
-
193
-
194
-
195
-
196
-
197
-
198
-
199
-
200
-
201
-
202
-
203
-
204
-
205
-
206
-
207
-
208
-
209
-
210
-
211
-
212
-
213
-
214
-
215
-
216
-
217
-
218
-
219
-
220
-
221
-
222
-
223
-
224
-
225
-
226
-
227
-
228
-
229
-
230
-
231
-
232
-
233
-
234
-
235
-
236
-
237
-
238
-
239
-
240
-
241
-
242
-
243
-
244
-
245
-
246
-
247
-
248
-
249
-
250
-
251
-
252
-
253
-
254
-
255
-
256
-
257
-
258
-
259
 |
 |

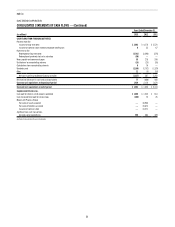
71
PART II
Years Ended December 31,
(in millions) 2013 2012 2011
CASH FLOWS FROM OPERATING ACTIVITIES
Net income $ 976 $ 865 $ 834
Adjustments to reconcile net income to net cash provided by operating activities:
Depreciation and amortization (including amortization of nuclear fuel) 1,167 1,143 1,020
Equity component of AFUDC (91) (154) (168)
FERC mitigation costs —46 —
Community support and charitable contributions expense 14 56 —
Gains on sales of other assets and other, net —(12) (1)
Impairment charges —— 12
Deferred income taxes 534 479 564
Voluntary opportunity cost deferral —(101) —
Accrued pension and other post-retirement benefit costs 38 41 32
Contributions to qualified pension plans —— (33)
(Increase) decrease in
Net realized and unrealized mark-to-market and hedging transactions (9) — (91)
Receivables (12) 22 22
Receivables from affiliated companies (72) (1) 88
Inventory (9) (128) (177)
Other current assets (1) 46 144
Increase (decrease) in
Accounts payable 58 (51) 120
Accounts payable to affiliated companies 33 (28) (39)
Taxes accrued 4(12) 12
Other current liabilities (40) 165 (170)
Other assets (102) (117) (46)
Other liabilities (77) (126) (249)
Net cash provided by operating activities 2,411 2,133 1,874
CASH FLOWS FROM INVESTING ACTIVITIES
Capital expenditures (1,695) (1,908) (2,272)
Purchases of available-for-sale securities (2,405) (2,481) (2,227)
Proceeds from sales and maturities of available-for-sale securities 2,363 2,445 2,179
Change in restricted cash —— 2
Notes receivable from affiliated companies 160 541 (584)
Other (24) (12) (13)
Net cash used in investing activities (1,601) (1,415) (2,915)
CASH FLOWS FROM FINANCING ACTIVITIES
Proceeds from the issuance of long-term debt 100 645 1,498
Payments for the redemption of long-term debt (405) (1,177) (7)
Distributions to parent (499) (450) (299)
Other (2) (6) (15)
Net cash (used in) provided by financing activities (806) (988) 1,177
Net increase (decrease) in cash and cash equivalents 4(270) 136
Cash and cash equivalents at beginning of period 19 289 153
Cash and cash equivalents at end of period $ 23 $ 19 $ 289
Supplemental Disclosures:
Cash paid for interest, net of amount capitalized $ 336 $ 385 $ 337
Cash received from income taxes (7) (38) (223)
Significant non-cash transactions:
Accrued capital expenditures 199 194 209
See Notes to Consolidated Financial Statements
DUKE ENERGY CAROLINAS, LLC
CONSOLIDATED STATEMENTS OF CASH FLOWS