Duke Energy 2013 Annual Report Download - page 117
Download and view the complete annual report
Please find page 117 of the 2013 Duke Energy annual report below. You can navigate through the pages in the report by either clicking on the pages listed below, or by using the keyword search tool below to find specific information within the annual report.-
 1
1 -
2
-
3
-
4
-
5
-
6
-
7
-
8
-
9
-
10
-
11
-
12
-
13
-
14
-
15
-
16
-
17
-
18
-
19
-
20
-
21
-
22
-
23
-
24
-
25
-
26
-
27
-
28
-
29
-
30
-
31
-
32
-
33
-
34
-
35
-
36
-
37
-
38
-
39
-
40
-
41
-
42
-
43
-
44
-
45
-
46
-
47
-
48
-
49
-
50
-
51
-
52
-
53
-
54
-
55
-
56
-
57
-
58
-
59
-
60
-
61
-
62
-
63
-
64
-
65
-
66
-
67
-
68
-
69
-
70
-
71
-
72
-
73
-
74
-
75
-
76
-
77
-
78
-
79
-
80
-
81
-
82
-
83
-
84
-
85
-
86
-
87
-
88
-
89
-
90
-
91
-
92
-
93
-
94
-
95
-
96
-
97
-
98
-
99
-
100
-
101
-
102
-
103
-
104
-
105
-
106
-
 107
107 -
 108
108 -
 109
109 -
 110
110 -
 111
111 -
 112
112 -
 113
113 -
 114
114 -
 115
115 -
 116
116 -
 117
117 -
 118
118 -
 119
119 -
 120
120 -
 121
121 -
 122
122 -
 123
123 -
 124
124 -
 125
125 -
 126
126 -
 127
127 -
128
-
129
-
130
-
131
-
132
-
133
-
134
-
135
-
136
-
137
-
138
-
139
-
140
-
141
-
142
-
143
-
144
-
145
-
146
-
147
-
148
-
149
-
150
-
151
-
152
-
153
-
154
-
155
-
156
-
157
-
158
-
159
-
160
-
161
-
162
-
163
-
164
-
165
-
166
-
167
-
168
-
169
-
170
-
171
-
172
-
173
-
174
-
175
-
176
-
177
-
178
-
179
-
180
-
181
-
182
-
183
-
184
-
185
-
186
-
187
-
188
-
189
-
190
-
191
-
192
-
193
-
194
-
195
-
196
-
197
-
198
-
199
-
200
-
201
-
202
-
203
-
204
-
205
-
206
-
207
-
208
-
209
-
210
-
211
-
212
-
213
-
214
-
215
-
216
-
217
-
218
-
219
-
220
-
221
-
222
-
223
-
224
-
225
-
226
-
227
-
228
-
229
-
230
-
231
-
232
-
233
-
234
-
235
-
236
-
237
-
238
-
239
-
240
-
241
-
242
-
243
-
244
-
245
-
246
-
247
-
248
-
249
-
250
-
251
-
252
-
253
-
254
-
255
-
256
-
257
-
258
-
259
 |
 |

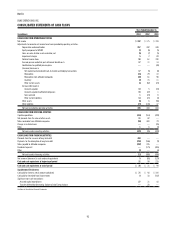
99
PART II
Accumulated Other
Comprehensive
Income (Loss)
(in millions)
Common
Stock
Additional
Paid-in Capital
Retained
Earnings
Net Gains
(Losses) on
Cash Flow Hedges
Total
Equity
Balance at December 31, 2010 $ 1 $1,358 $2,200 $ 8 $3,567
Net income — — 168 — 168
Other comprehensive loss (1) (1)
Balance at December 31, 2011 $ 1 $1,358 $2,368 $ 7 $3,734
Net loss — — (50) — (50)
Other comprehensive loss — — — (2) (2)
Transfer of Vermillion Generating Station from Duke Energy Ohio — 26 — — 26
Balance at December 31, 2012 $ 1 $1,384 $2,318 $ 5 $3,708
Net income — — 358 — 358
Other comprehensive loss — — — (2) (2)
Dividend to parent — — (125) — (125)
Balance at December 31, 2013 $ 1 $1,384 $2,551 $ 3 $3,939
See Notes to Consolidated Financial Statements
DUKE ENERGY INDIANA, INC.
CONSOLIDATED STATEMENTS OF CHANGES IN COMMON STOCKHOLDER’S EQUITY