Duke Energy 2013 Annual Report Download - page 50
Download and view the complete annual report
Please find page 50 of the 2013 Duke Energy annual report below. You can navigate through the pages in the report by either clicking on the pages listed below, or by using the keyword search tool below to find specific information within the annual report.-
 1
1 -
2
-
3
-
4
-
5
-
6
-
7
-
8
-
9
-
10
-
11
-
12
-
13
-
14
-
15
-
16
-
17
-
18
-
19
-
20
-
21
-
22
-
23
-
24
-
25
-
26
-
27
-
28
-
29
-
30
-
31
-
32
-
33
-
34
-
35
-
36
-
37
-
38
-
39
-
 40
40 -
 41
41 -
 42
42 -
 43
43 -
 44
44 -
 45
45 -
 46
46 -
 47
47 -
 48
48 -
 49
49 -
 50
50 -
 51
51 -
 52
52 -
 53
53 -
 54
54 -
 55
55 -
 56
56 -
 57
57 -
 58
58 -
 59
59 -
 60
60 -
61
-
62
-
63
-
64
-
65
-
66
-
67
-
68
-
69
-
70
-
71
-
72
-
73
-
74
-
75
-
76
-
77
-
78
-
79
-
80
-
81
-
82
-
83
-
84
-
85
-
86
-
87
-
88
-
89
-
90
-
91
-
92
-
93
-
94
-
95
-
96
-
97
-
98
-
99
-
100
-
101
-
102
-
103
-
104
-
105
-
106
-
107
-
108
-
109
-
110
-
111
-
112
-
113
-
114
-
115
-
116
-
117
-
118
-
119
-
120
-
121
-
122
-
123
-
124
-
125
-
126
-
127
-
128
-
129
-
130
-
131
-
132
-
133
-
134
-
135
-
136
-
137
-
138
-
139
-
140
-
141
-
142
-
143
-
144
-
145
-
146
-
147
-
148
-
149
-
150
-
151
-
152
-
153
-
154
-
155
-
156
-
157
-
158
-
159
-
160
-
161
-
162
-
163
-
164
-
165
-
166
-
167
-
168
-
169
-
170
-
171
-
172
-
173
-
174
-
175
-
176
-
177
-
178
-
179
-
180
-
181
-
182
-
183
-
184
-
185
-
186
-
187
-
188
-
189
-
190
-
191
-
192
-
193
-
194
-
195
-
196
-
197
-
198
-
199
-
200
-
201
-
202
-
203
-
204
-
205
-
206
-
207
-
208
-
209
-
210
-
211
-
212
-
213
-
214
-
215
-
216
-
217
-
218
-
219
-
220
-
221
-
222
-
223
-
224
-
225
-
226
-
227
-
228
-
229
-
230
-
231
-
232
-
233
-
234
-
235
-
236
-
237
-
238
-
239
-
240
-
241
-
242
-
243
-
244
-
245
-
246
-
247
-
248
-
249
-
250
-
251
-
252
-
253
-
254
-
255
-
256
-
257
-
258
-
259
 |
 |

32
PART II
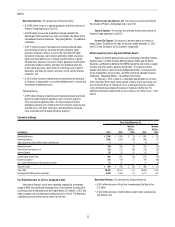
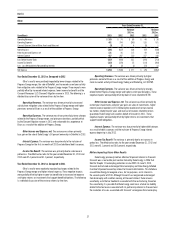
Year Ended December 31, 2013 as Compared to 2012
Regulated Utilities’ results were positively impacted by 2012 impairment
and other charges related to the Edwardsport IGCC plant, higher retail pricing
and rate riders, the inclusion of Progress Energy results for the first six months
of 2013, a net increase in wholesale power revenues, and higher weather normal
sales volumes. These impacts were partially offset by higher income tax expense,
Crystal River Unit 3 charges, lower AFUDC equity and higher depreciation and
amortization expense. The following is a detailed discussion of the variance
drivers by line item.
Operating Revenues. The variance was driven primarily by:
• A $4,339 million increase due to the inclusion of Progress Energy for the
first six months of 2013,
• A $434 million net increase in retail pricing primarily due to revised
rates approved in all jurisdictions;
• A $76 million net increase in wholesale power revenues, net of sharing,
primarily due to additional volumes and charges for capacity for
customers served under long-term contracts; and
• A $72 million increase in weather-normal sales volumes to retail
customers (net of fuel revenue) reflecting increased demand.
Partially offset by:
• A $132 million decrease in fuel revenues (including emission
allowances) driven primarily by (i) the impact of lower Florida residential
fuel rates, including amortization associated with the settlement
agreement approved by the FPSC in 2012 (2012 Settlement), (ii) lower
fuel rates for electric retail customers in the Carolinas, Florida and
Ohio, and (iii) lower revenues for purchased power, partially offset by
(iv) increased demand from electric retail customers. Fuel revenues
represent sales to retail and wholesale customers.
Operating Expenses. The variance was driven primarily by:
• A $3,393 million increase due to the inclusion of Progress Energy for the
first six months of 2013,
• A $346 million increase in impairment and other charges in 2013
primarily related to Crystal River Unit 3 and Levy. See Note 4 to the
Consolidated Financial Statements, “Regulatory Matters,” for additional
information, and
• A $102 million increase in depreciation and amortization expense
primarily due to a decrease in the reduction of the cost of removal
component of amortization expense as allowed under the 2012
Settlement.
Partially offset by:
• A $600 million decrease due to 2012 impairment and other charges
related to the Edwardsport IGCC plant. See Note 4 to the Consolidated
Financial Statements, “Regulatory Matters,” for additional information,
and
• A $120 million decrease in fuel expense (including purchased power
and natural gas purchases for resale) primarily related to (i) the
application of the NEIL settlement proceeds in Florida, including
amortization associated with the 2012 Settlement; (ii) lower purchased
power costs in (a) the Carolinas, primarily due to additional generating
capacity placed in service in late 2012 and market conditions, (b) Ohio,
primarily due to reduced sales volumes, and (c) Indiana, reflective of
market conditions; partially offset by (iii) higher volumes of natural
gas used in electric generation due primarily to additional generating
capacity placed in service; (iv) higher prices for natural gas and coal
used in electric generation; and (v) higher volumes of coal used in
electric generation primarily due to generation mix.
Other Income and Expenses, net. The decrease is primarily due to
lower AFUDC equity, resulting from major projects that were placed into service
in late 2012 and the implementation of new customer rates related to the IGCC
rider, partially offset by the inclusion of Progress Energy for the first six months
of 2013.
Interest Expense. The variance was primarily driven by the inclusion of
Progress Energy for the first six months of 2013.
Income Tax Expense. The variance was primarily due to an increase in
pretax income. The effective tax rates for the years ended December 31, 2013
and 2012 were 37.8 percent and 35 percent, respectively. The increase in
the effective tax rate was primarily due to an increase in pretax income and a
reduction in AFUDC equity.
Year Ended December 31, 2012 as Compared to 2011
Regulated Utilities’ results were positively impacted by the inclusion of
Progress Energy results beginning in July 2012, higher net retail pricing and rate
riders and decreased operating and maintenance expenses. These impacts were
partially offset by additional charges related to the Edwardsport IGCC plant,
unfavorable weather, and increased depreciation and amortization.
Operating Revenues. The variance was driven primarily by:
• A $4,918 million increase in operating revenues due to the inclusion of
Progress Energy beginning in July 2012;
• A $352 million net increase in retail pricing and rate riders primarily
due to revised retail rates resulting from the 2011 North Carolina and
South Carolina rate cases implemented in the first quarter of 2012, and
revenues recognized for energy efficiency programs; and
• A $293 million increase in fuel revenues (including emission
allowances) driven primarily by higher revenues in Ohio for purchases
of power as a result of the Ohio Electric Stabilization Plan (ESP), higher
fuel rates for electric retail customers in all jurisdictions, and higher
revenues for purchases of power in Indiana and the Carolinas, partially
offset by decreased demand from electric retail customers in 2012
mainly due to unfavorable weather conditions, and lower demand and
fuel rates in Ohio and Kentucky from natural gas retail customers. Fuel
revenues represent sales to retail and wholesale customers.
Partially offset by:
• A $155 million decrease in electric and gas sales (net of fuel) to retail
customers due to unfavorable weather conditions in 2012 compared
to 2011. For the Carolinas, weather statistics for cooling degree days
in 2012 were less favorable compared to 2011, while cooling degree
days in Ohio and Indiana were favorable in 2012 compared to the same
period in 2011. For the Carolinas, Ohio and Indiana, weather statistics
for heating degree days in 2012 were unfavorable compared to 2011.