Duke Energy 2013 Annual Report Download - page 67
Download and view the complete annual report
Please find page 67 of the 2013 Duke Energy annual report below. You can navigate through the pages in the report by either clicking on the pages listed below, or by using the keyword search tool below to find specific information within the annual report.-
 1
1 -
2
-
3
-
4
-
5
-
6
-
7
-
8
-
9
-
10
-
11
-
12
-
13
-
14
-
15
-
16
-
17
-
18
-
19
-
20
-
21
-
22
-
23
-
24
-
25
-
26
-
27
-
28
-
29
-
30
-
31
-
32
-
33
-
34
-
35
-
36
-
37
-
38
-
39
-
40
-
41
-
42
-
43
-
44
-
45
-
46
-
47
-
48
-
49
-
50
-
51
-
52
-
53
-
54
-
55
-
56
-
 57
57 -
 58
58 -
 59
59 -
 60
60 -
 61
61 -
 62
62 -
 63
63 -
 64
64 -
 65
65 -
 66
66 -
 67
67 -
 68
68 -
 69
69 -
 70
70 -
 71
71 -
 72
72 -
 73
73 -
 74
74 -
 75
75 -
 76
76 -
 77
77 -
78
-
79
-
80
-
81
-
82
-
83
-
84
-
85
-
86
-
87
-
88
-
89
-
90
-
91
-
92
-
93
-
94
-
95
-
96
-
97
-
98
-
99
-
100
-
101
-
102
-
103
-
104
-
105
-
106
-
107
-
108
-
109
-
110
-
111
-
112
-
113
-
114
-
115
-
116
-
117
-
118
-
119
-
120
-
121
-
122
-
123
-
124
-
125
-
126
-
127
-
128
-
129
-
130
-
131
-
132
-
133
-
134
-
135
-
136
-
137
-
138
-
139
-
140
-
141
-
142
-
143
-
144
-
145
-
146
-
147
-
148
-
149
-
150
-
151
-
152
-
153
-
154
-
155
-
156
-
157
-
158
-
159
-
160
-
161
-
162
-
163
-
164
-
165
-
166
-
167
-
168
-
169
-
170
-
171
-
172
-
173
-
174
-
175
-
176
-
177
-
178
-
179
-
180
-
181
-
182
-
183
-
184
-
185
-
186
-
187
-
188
-
189
-
190
-
191
-
192
-
193
-
194
-
195
-
196
-
197
-
198
-
199
-
200
-
201
-
202
-
203
-
204
-
205
-
206
-
207
-
208
-
209
-
210
-
211
-
212
-
213
-
214
-
215
-
216
-
217
-
218
-
219
-
220
-
221
-
222
-
223
-
224
-
225
-
226
-
227
-
228
-
229
-
230
-
231
-
232
-
233
-
234
-
235
-
236
-
237
-
238
-
239
-
240
-
241
-
242
-
243
-
244
-
245
-
246
-
247
-
248
-
249
-
250
-
251
-
252
-
253
-
254
-
255
-
256
-
257
-
258
-
259
 |
 |

49
PART II
PremierNotes
Duke Energy has an effective Form S-3 with the SEC to sell up to $3 billion
of variable denomination floating rate demand notes, called PremierNotes.
The Form S-3 states that no more than $1.5 billion of the notes will be
outstanding at any particular time. The notes are offered on a continuous basis
and bear interest at a floating rate per annum determined by the Duke Energy
PremierNotes Committee, or its designee, on a weekly basis. The interest rate
payable on notes held by an investor may vary based on the principal amount
of the investment. The notes have no stated maturity date, are non-transferable
and may be redeemed in whole or in part by Duke Energy or at the investor’s
option at any time. The balance as of December 31, 2013 and December 31,
2012, was $836 million and $395 million, respectively. The notes are short-
term debt obligations of Duke Energy and are reflected as Notes payable and
commercial paper on Duke Energy’s Consolidated Balance Sheets.
Shelf Registration
In September 2013, Duke Energy filed a Form S-3 with the SEC. Under this
Form S-3, which is uncapped, the Duke Energy Registrants, excluding Progress
Energy may issue debt and other securities in the future at amounts, prices
and with terms to be determined at the time of future offerings. The registration
statement also allows for the issuance of common stock by Duke Energy.
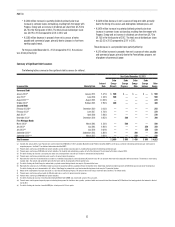
CAPITAL EXPENDITURES
Duke Energy’s projected capital and investment expenditures for the next
three fiscal years are included in the table below.
(in millions) 2014 2015 2016
Regulated Utilities $ 4,850 $ 6,075 $ 6,500
Commercial Power, International Energy and Other 975 775 675
Total committed expenditures 5,825 6,850 7,175
Discretionary expenditures 300 600 1,000
Total projected capital and investment expenditures $ 6,125 $ 7,450 $ 8,175
Duke Energy continues to focus on reducing risk and positioning its
business for future success and will invest principally in its strongest business
sectors. Based on this goal, the majority of Duke Energy’s total projected capital
expenditures are allocated to the Regulated Utilities segment. The table below
includes the components of projected capital expenditures for Regulated Utilities
for the next three fiscal years.
2014 2015 2016
New generation $ 200 $ 975 $ 1,175
Environmental 400 250 250
Nuclear fuel 525 525 575
Major nuclear 350 375 325
Customer additions 425 450 475
Grid modernization and other transmission and distribution
projects 125 450 525
Maintenance 2,825 3,050 3,175
Total projected Regulated Utilities capital and investment
expenditures $ 4,850 $ 6,075 $ 6,500
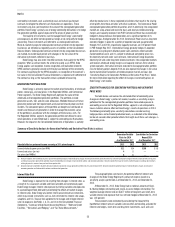
DEBT MATURITIES
The following table shows the significant components of Current maturities
of long-term debt on the Consolidated Balance Sheets. The Duke Energy
Registrants currently anticipate satisfying these obligations, primarily with cash
on hand and proceeds from additional borrowings.
(in millions) Maturity Date Interest Rate
December 31,
2013
Unsecured Debt
Duke Energy (Parent) February 2014 6.300 % $ 750
Progress Energy (Parent) March 2014 6.050 % 300
Duke Energy (Parent) September 2014 3.950 % 500
Tax-exempt Bonds
Duke Energy Progress January 2014 0.105 % 167
Other 387
Current maturities of
long-term debt $ 2,104
DIVIDEND PAYMENTS
Duke Energy has paid quarterly cash dividends for 88 consecutive years
and expects to continue its policy of paying regular cash dividends in the future.
There is no assurance as to the amount of future dividends because they depend
on future earnings, capital requirements, financial condition and are subject to
the discretion of the Board of Directors.
Over the past several years, Duke Energy’s dividend has grown at
approximately two percent annually, slower than overall earnings growth. The
Board of Directors continues to target a payout ratio of 65 percent to 70 percent,
based upon adjusted diluted EPS. Once the dividend is within the target payout
ratio, Duke Energy believes it has the flexibility to grow the dividend at a pace
more consistent with earnings growth.
Dividend and Other Funding Restrictions of Duke Energy Subsidiaries
As discussed in Note 4 to the Consolidated Financial Statements
“Regulatory Matters”, Duke Energy’s wholly owned public utility operating
companies have restrictions on the amount of funds that can be transferred to
Duke Energy via dividend, advance or loan as a result of conditions imposed by
various regulators in conjunction with merger transactions. Duke Energy Progress
and Duke Energy Florida also have restrictions imposed by their first mortgage
bond indentures and Articles of Incorporation which, in certain circumstances,
limit their ability to make cash dividends or distributions on common stock.
Additionally, certain other Duke Energy subsidiaries have other restrictions, such
as minimum working capital and tangible net worth requirements pursuant to
debt and other agreements that limit the amount of funds that can be transferred
to Duke Energy. At December 31, 2013, the amount of restricted net assets
of wholly owned subsidiaries of Duke Energy that may not be distributed to
Duke Energy in the form of a loan or dividend is less than 25 percent of Duke
Energy’s consolidated net assets. Duke Energy does not have any legal or
other restrictions on paying common stock dividends to shareholders out of
its consolidated equity accounts. Although these restrictions cap the amount
of funding the various operating subsidiaries can provide to Duke Energy,
management does not believe these restrictions will have any significant impact
on Duke Energy’s ability to access cash to meet its payment of dividends on
common stock and other future funding obligations.