Duke Energy 2013 Annual Report Download - page 69
Download and view the complete annual report
Please find page 69 of the 2013 Duke Energy annual report below. You can navigate through the pages in the report by either clicking on the pages listed below, or by using the keyword search tool below to find specific information within the annual report.-
 1
1 -
2
-
3
-
4
-
5
-
6
-
7
-
8
-
9
-
10
-
11
-
12
-
13
-
14
-
15
-
16
-
17
-
18
-
19
-
20
-
21
-
22
-
23
-
24
-
25
-
26
-
27
-
28
-
29
-
30
-
31
-
32
-
33
-
34
-
35
-
36
-
37
-
38
-
39
-
40
-
41
-
42
-
43
-
44
-
45
-
46
-
47
-
48
-
49
-
50
-
51
-
52
-
53
-
54
-
55
-
56
-
57
-
58
-
 59
59 -
 60
60 -
 61
61 -
 62
62 -
 63
63 -
 64
64 -
 65
65 -
 66
66 -
 67
67 -
 68
68 -
 69
69 -
 70
70 -
 71
71 -
 72
72 -
 73
73 -
 74
74 -
 75
75 -
 76
76 -
 77
77 -
 78
78 -
 79
79 -
80
-
81
-
82
-
83
-
84
-
85
-
86
-
87
-
88
-
89
-
90
-
91
-
92
-
93
-
94
-
95
-
96
-
97
-
98
-
99
-
100
-
101
-
102
-
103
-
104
-
105
-
106
-
107
-
108
-
109
-
110
-
111
-
112
-
113
-
114
-
115
-
116
-
117
-
118
-
119
-
120
-
121
-
122
-
123
-
124
-
125
-
126
-
127
-
128
-
129
-
130
-
131
-
132
-
133
-
134
-
135
-
136
-
137
-
138
-
139
-
140
-
141
-
142
-
143
-
144
-
145
-
146
-
147
-
148
-
149
-
150
-
151
-
152
-
153
-
154
-
155
-
156
-
157
-
158
-
159
-
160
-
161
-
162
-
163
-
164
-
165
-
166
-
167
-
168
-
169
-
170
-
171
-
172
-
173
-
174
-
175
-
176
-
177
-
178
-
179
-
180
-
181
-
182
-
183
-
184
-
185
-
186
-
187
-
188
-
189
-
190
-
191
-
192
-
193
-
194
-
195
-
196
-
197
-
198
-
199
-
200
-
201
-
202
-
203
-
204
-
205
-
206
-
207
-
208
-
209
-
210
-
211
-
212
-
213
-
214
-
215
-
216
-
217
-
218
-
219
-
220
-
221
-
222
-
223
-
224
-
225
-
226
-
227
-
228
-
229
-
230
-
231
-
232
-
233
-
234
-
235
-
236
-
237
-
238
-
239
-
240
-
241
-
242
-
243
-
244
-
245
-
246
-
247
-
248
-
249
-
250
-
251
-
252
-
253
-
254
-
255
-
256
-
257
-
258
-
259
 |
 |

51
PART II
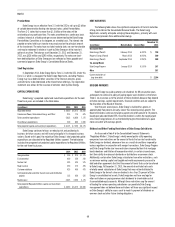
OPERATING CASH FLOWS
The following table summarizes key components of Duke Energy’s
operating cash flows for the three most recently completed fiscal years.
(in millions)
Years Ended December 31,
2013 2012 2011
Net income $ 2,676 $ 1,782 $ 1,714
Non-cash adjustments to net income 4,876 3,769 2,628
Contributions to qualified pension plans (250) (304) (200)
Working capital (920) (3) (470)
Net cash provided by operating activities $ 6,382 $ 5,244 $ 3,672
For the year ended December 31, 2013 compared to 2012, the variance
was driven primarily by:
• A $2,001 million increase in net income after non-cash adjustments,
mainly due to the inclusion of Progress Energy’s results for first six
months of 2013 and the impact of revised rates and lower operation and
maintenance expenses, partially offset by;
• A $917 million decrease in operating cash flows from increased investments
in traditional working capital, mainly due to the timing of receivables and
accruals, lower incentive accruals, net of current year payments and reserve
reductions and the prior year overallocation of the Carolinas’ fuels costs.
These decreases were partially offset by the NEIL proceeds.
For the year ended December 31, 2012 compared to 2011, the variance
was driven primarily by:
• An approximately $1,210 million increase in net income after non-cash
adjustments (depreciation and amortizations, higher Edwardsport
charges, severance expense and other Progress Energy merger related
costs), resulting from the inclusion of Progress Energy’s results
beginning July 2, 2012 and the impact of the 2011 North Carolina and
South Carolina rate cases, net of unfavorable weather.
• A $560 million increase in operating cash flows from lower investment
in traditional working capital, mainly due to an increase in current year
vacation and incentive accruals and prior year refund of North Carolina
overcollected fuels costs and current year overcollection of North
Carolina and South Carolina fuel costs, partially offset by;
• A $100 million increase in contributions to company sponsored pension
plans due to contributions for Progress Energy pension plans.
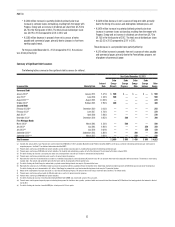
INVESTING CASH FLOWS
The following table summarizes key components of Duke Energy’s
investing cash flows for the three most recently completed fiscal years.
(in millions)
Years Ended December 31,
2013 2012 2011
Capital, investment and acquisition expenditures $ (5,607) $ (5,958) $ (4,464)
Available for sale securities, net 173 (182) (131)
Proceeds from sales of equity investments and
other assets, and sales of and collections on
notes receivable 277 212 118
Other investing items 179 (269) 43
Net cash used in investing activities $ (4,978) $ (6,197) $ (4,434)
The primary use of cash related to investing activities is capital,
investment and acquisition expenditures, detailed by reportable business
segment in the following table.
(in millions)
Years Ended December 31,
2013 2012 2011
Regulated Utilities $ 5,049 $ 4,220 $ 3,717
Commercial Power 268 1,038 492
International Energy 67 551 114
Other 223 149 141
Total capital, investment and acquisition
expenditures $ 5,607 $ 5,958 $ 4,464
For the year ended December 31, 2013 compared to 2012, the variance
was driven primarily by:
• A $581 million variance in restricted cash due to posting collateral on a
secured debt issuance related to the Chilean hydro acquisition in 2012
and the return of a portion of this collateral in 2013,
• A $355 million increase in proceeds from the sales of available-for-sale
securities, net of purchases due to the investment of excess cash held
in foreign jurisdictions and
• A $351 million decrease in capital, investment and acquisition
expenditures primarily due to lower spending on Duke Energy’s
renewable energy projects and ongoing infrastructure modernization
program as these projects were completed, net of expenditures on
Progress Energy’s maintenance projects.
For the year ended December 31, 2012 compared to 2011, the variance
was driven primarily by:
• A $1,490 million increase in capital, investment and acquisition
expenditures primarily due to the inclusion of Progress Energy’s capital
expenditures beginning July 2, 2012, higher expenditures on renewable
energy projects and the Chilean hydro acquisition, net of lower spending
on Duke Energy’s ongoing infrastructure modernization program as
these projects near completion and
• A $440 million increase in restricted cash primarily due to a secured
debt issuance related to Chilean hydro acquisition.
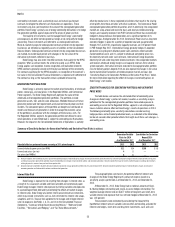
FINANCING CASH FLOWS
The following table summarizes key components of Duke Energy’s
financing cash flows for the three most recently completed fiscal years.
(in millions)
Years Ended December 31,
2013 2012 2011
Issuance of common stock related to employee benefit
plans $ 9 $ 23 $ 67
Issuance of long-term debt, net 840 1,672 2,292
Notes payable and commercial paper 93 278 208
Dividends paid (2,188) (1,752) (1,329)
Other financing items (81) 46 (36)
Net cash (used in) provided by financing activities $ (1,327) $ 267 $ 1,202
For the year ended December 31, 2013 compared to 2012, the variance
was driven primarily by:
• An $832 million decrease in net issuances of long-term debt, primarily
due to the timing of issuances and redemptions between years, resulting
from the completion of major construction projects,