Duke Energy 2013 Annual Report Download - page 220
Download and view the complete annual report
Please find page 220 of the 2013 Duke Energy annual report below. You can navigate through the pages in the report by either clicking on the pages listed below, or by using the keyword search tool below to find specific information within the annual report.-
 1
1 -
2
-
3
-
4
-
5
-
6
-
7
-
8
-
9
-
10
-
11
-
12
-
13
-
14
-
15
-
16
-
17
-
18
-
19
-
20
-
21
-
22
-
23
-
24
-
25
-
26
-
27
-
28
-
29
-
30
-
31
-
32
-
33
-
34
-
35
-
36
-
37
-
38
-
39
-
40
-
41
-
42
-
43
-
44
-
45
-
46
-
47
-
48
-
49
-
50
-
51
-
52
-
53
-
54
-
55
-
56
-
57
-
58
-
59
-
60
-
61
-
62
-
63
-
64
-
65
-
66
-
67
-
68
-
69
-
70
-
71
-
72
-
73
-
74
-
75
-
76
-
77
-
78
-
79
-
80
-
81
-
82
-
83
-
84
-
85
-
86
-
87
-
88
-
89
-
90
-
91
-
92
-
93
-
94
-
95
-
96
-
97
-
98
-
99
-
100
-
101
-
102
-
103
-
104
-
105
-
106
-
107
-
108
-
109
-
110
-
111
-
112
-
113
-
114
-
115
-
116
-
117
-
118
-
119
-
120
-
121
-
122
-
123
-
124
-
125
-
126
-
127
-
128
-
129
-
130
-
131
-
132
-
133
-
134
-
135
-
136
-
137
-
138
-
139
-
140
-
141
-
142
-
143
-
144
-
145
-
146
-
147
-
148
-
149
-
150
-
151
-
152
-
153
-
154
-
155
-
156
-
157
-
158
-
159
-
160
-
161
-
162
-
163
-
164
-
165
-
166
-
167
-
168
-
169
-
170
-
171
-
172
-
173
-
174
-
175
-
176
-
177
-
178
-
179
-
180
-
181
-
182
-
183
-
184
-
185
-
186
-
187
-
188
-
189
-
190
-
191
-
192
-
193
-
194
-
195
-
196
-
197
-
198
-
199
-
200
-
201
-
202
-
203
-
204
-
205
-
206
-
207
-
208
-
209
-
 210
210 -
 211
211 -
 212
212 -
 213
213 -
 214
214 -
 215
215 -
 216
216 -
 217
217 -
 218
218 -
 219
219 -
 220
220 -
 221
221 -
 222
222 -
 223
223 -
 224
224 -
 225
225 -
 226
226 -
 227
227 -
 228
228 -
 229
229 -
 230
230 -
231
-
232
-
233
-
234
-
235
-
236
-
237
-
238
-
239
-
240
-
241
-
242
-
243
-
244
-
245
-
246
-
247
-
248
-
249
-
250
-
251
-
252
-
253
-
254
-
255
-
256
-
257
-
258
-
259
 |
 |

202
PART II
DUKE ENERGY CORPORATION • DUKE ENERGY CAROLINAS, LLC • PROGRESS ENERGY, INC. •
DUKE ENERGY PROGRESS, INC. • DUKE ENERGY FLORIDA, INC. • DUKE ENERGY OHIO, INC. • DUKE ENERGY INDIANA, INC.
Combined Notes to Consolidated Financial Statements – (Continued)
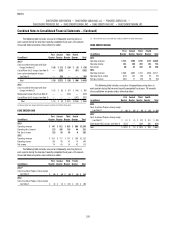
On July 23, 2013, HB 998 was signed into law. HB 998 reduces the North
Carolina corporate income tax rate from a statutory 6.9 percent to
6.0 percent in January 2014 with a further reduction to 5.0 percent in January
2015. Duke Energy recorded a net reduction of approximately $145 million
to its North Carolina deferred tax liability in the third quarter of 2013. The
significant majority of this deferred tax liability reduction was offset by recording
a regulatory liability pending NCUC determination of the disposition of the
amounts related to Duke Energy Carolinas and Duke Energy Progress. The
impact of HB 998 did not have a significant impact on the financial position,
results of operation, or cash flows of Duke Energy, Duke Energy Carolinas,
Progress Energy or Duke Energy Progress.
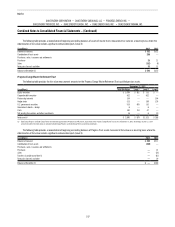
The following table presents the expiration of tax credits and NOL carryforwards.
December 31, 2013
(in millions) Amount
Expiration
Year
Investment Tax Credits $ 498 2029 —2033
Alternative Minimum Tax Credits 1,028 Indefinite
Federal NOL carryforwards 2,471 2030 — 2033
State NOL carryforwards and credits(a) 189 2014 — 2033
Foreign NOL carryforwards(b) 121 2015 — 2033
Total tax credits and NOL carryforwards $ 4,307
(a) A valuation allowance of $83 million has been recorded on the state NOL carryforwards, state tax credits and state capital loss carryforwards, as presented in the Net Deferred Income Tax Liability Components table.
(b) A valuation allowance of $109 million has been recorded on the foreign NOL carryforwards, as presented in the Net Deferred Income Tax Liability Components table. Certain foreign NOL carryforwards have an indefinite
expiration period.
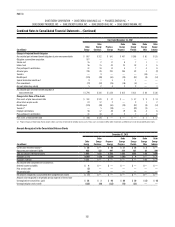
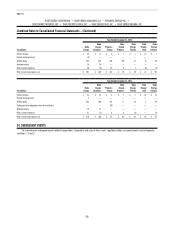
December 31, 2012
(in millions)
Duke
Energy
Duke
Energy
Carolinas
Progress
Energy
Duke
Energy
Progress
Duke
Energy
Florida
Duke
Energy
Ohio
Duke
Energy
Indiana
Deferred credits and other liabilities $ 256 $ 64 $ 110 $ 24 $ 76 $ (10) $ 22
Capital lease obligations 60 13 — — — — (1)
Pension, postretirement and other employee benefits 1,320 117 712 318 257 62 94
Progress Energy merger purchase accounting adjustments(a) 1,312 — — — — — —
Tax credits and NOL carryforwards 3,311 447 1,536 309 91 152 340
Other 408 22 230 82 126 10 27
Valuation allowance (226) — (77) — — (1) —
Total deferred income tax assets 6,441 663 2,511 733 550 213 482
Investments and other assets (1,093) (838) (112) (108) (6) (25) (18)
Accelerated depreciation rates (11,208) (4,289) (2,803) (2,178) (592) (1,823) (1,131)
Regulatory assets and deferred debits (3,819) (627) (1,775) (465) (1,318) (197) (185)
Total deferred income tax liabilities (16,120) (5,754) (4,690) (2,751) (1,916) (2,045) (1,334)
Net deferred income tax liabilities $ (9,679) $(5,091) $(2,179) $(2,018) $(1,366) $(1,832) $ (852)
(a) Primarily related to capital lease obligations and debt fair value adjustments.
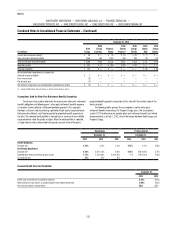
Classification of Deferred Tax Assets (Liabilities) in the Consolidated Balance Sheets
December 31, 2013
(in millions)
Duke
Energy
Duke
Energy
Carolinas
Progress
Energy
Duke
Energy
Progress
Duke
Energy
Florida
Duke
Energy
Ohio
Duke
Energy
Indiana
Current Assets: Other $ 1,373 $ 286 $ 540 $ 229 $ 110 $ 85 $ 52
Investments and Other Assets: Other 45 — — — — — —
Deferred Credits and Other Liabilities: Other (12,097) (5,706) (3,283) (2,557) (1,829) (2,012) (1,171)
Net deferred income tax liabilities $(10,679) $(5,420) $(2,743) $(2,328) $(1,719) $(1,927) $(1,119)