Duke Energy 2013 Annual Report Download - page 66
Download and view the complete annual report
Please find page 66 of the 2013 Duke Energy annual report below. You can navigate through the pages in the report by either clicking on the pages listed below, or by using the keyword search tool below to find specific information within the annual report.-
 1
1 -
2
-
3
-
4
-
5
-
6
-
7
-
8
-
9
-
10
-
11
-
12
-
13
-
14
-
15
-
16
-
17
-
18
-
19
-
20
-
21
-
22
-
23
-
24
-
25
-
26
-
27
-
28
-
29
-
30
-
31
-
32
-
33
-
34
-
35
-
36
-
37
-
38
-
39
-
40
-
41
-
42
-
43
-
44
-
45
-
46
-
47
-
48
-
49
-
50
-
51
-
52
-
53
-
54
-
55
-
 56
56 -
 57
57 -
 58
58 -
 59
59 -
 60
60 -
 61
61 -
 62
62 -
 63
63 -
 64
64 -
 65
65 -
 66
66 -
 67
67 -
 68
68 -
 69
69 -
 70
70 -
 71
71 -
 72
72 -
 73
73 -
 74
74 -
 75
75 -
 76
76 -
77
-
78
-
79
-
80
-
81
-
82
-
83
-
84
-
85
-
86
-
87
-
88
-
89
-
90
-
91
-
92
-
93
-
94
-
95
-
96
-
97
-
98
-
99
-
100
-
101
-
102
-
103
-
104
-
105
-
106
-
107
-
108
-
109
-
110
-
111
-
112
-
113
-
114
-
115
-
116
-
117
-
118
-
119
-
120
-
121
-
122
-
123
-
124
-
125
-
126
-
127
-
128
-
129
-
130
-
131
-
132
-
133
-
134
-
135
-
136
-
137
-
138
-
139
-
140
-
141
-
142
-
143
-
144
-
145
-
146
-
147
-
148
-
149
-
150
-
151
-
152
-
153
-
154
-
155
-
156
-
157
-
158
-
159
-
160
-
161
-
162
-
163
-
164
-
165
-
166
-
167
-
168
-
169
-
170
-
171
-
172
-
173
-
174
-
175
-
176
-
177
-
178
-
179
-
180
-
181
-
182
-
183
-
184
-
185
-
186
-
187
-
188
-
189
-
190
-
191
-
192
-
193
-
194
-
195
-
196
-
197
-
198
-
199
-
200
-
201
-
202
-
203
-
204
-
205
-
206
-
207
-
208
-
209
-
210
-
211
-
212
-
213
-
214
-
215
-
216
-
217
-
218
-
219
-
220
-
221
-
222
-
223
-
224
-
225
-
226
-
227
-
228
-
229
-
230
-
231
-
232
-
233
-
234
-
235
-
236
-
237
-
238
-
239
-
240
-
241
-
242
-
243
-
244
-
245
-
246
-
247
-
248
-
249
-
250
-
251
-
252
-
253
-
254
-
255
-
256
-
257
-
258
-
259
 |
 |

48
PART II
Duke Energy’s U.S. post-retirement plan uses a medical care trend rate which reflects the near and long-term expectation of increases in medical health care costs.
Duke Energy’s U.S. post-retirement plan uses a prescription drug trend rate, which reflects the near and long-term expectation of increases in prescription drug health care
costs. As of December 31, 2013, the medical care trend rates were 8.5 percent, which grades to 5.00 percent by 2021. The following table presents the approximate effect on
Duke Energy’s 2013 pretax other post-retirement expense and other post-retirement benefit obligation if a 1 percentage point change in the health care trend rate were to occur.
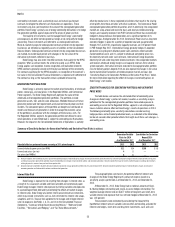
Other Post-retirement Plans
(in millions) +1.0% -1.0%
Effect on 2013 other post-retirement expense $ 25 $(20)
Effect on other post-retirement benefit obligation at December 31, 2013 40 (36)
For further information, see Note 21 to the Consolidated Financial Statements, “Employee Benefit Plans.”
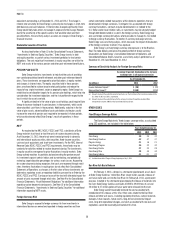
LIQUIDITY AND CAPITAL RESOURCES
Sources and Uses of Cash
Duke Energy relies primarily upon cash flows from operations, debt
issuances and its existing cash and cash equivalents to fund its domestic
liquidity and capital requirements. Duke Energy’s capital requirements arise
primarily from capital and investment expenditures, repaying long-term debt and
paying dividends to shareholders. Duke Energy’s projected primary sources and
uses for the next three fiscal years are included in the table below.
(in millions) 2014 2015 2016
Uses:
Capital expenditures 5,825-6,125 6,850-7,450 7,175-8,175
Debt maturities(a) 2,170 2,470 1,870
Dividend payments 2,225 2,270 2,315
Sources:
Cash flows from operations $ 7,370 $ 7,930 $ 8,150
Debt issuances 3,160 3,475 2,800
(a) Excludes capital leases and securitized receivables maturities in 2016 expected to be renewed. Amount
represents Duke Energy’s financing plan, which accelerates certain contractual maturities.
The Subsidiary Registrants generally maintain minimal cash balances and
use short-term borrowings to meet their working capital needs and other cash
requirements. The Subsidiary Registrants, excluding Progress Energy, support
their short-term borrowing needs through participation with Duke Energy and
certain of its other subsidiaries in a money pool arrangement. The companies with
short-term funds may provide short-term loans to affiliates participating under
this arrangement. See Note 6 to the Consolidated Financial Statements, “Debt
and Credit Facilities,” for additional discussion of the money pool arrangement.
Duke Energy and the Subsidiary Registrants, excluding Progress Energy, may
also use short-term debt, including commercial paper and the money pool, as a
bridge to long-term debt financings. The levels of borrowing may vary significantly
over the course of the year due to the timing of long-term debt financings and
the impact of fluctuations in cash flows from operations. Duke Energy’s current
liabilities frequently exceed current assets resulting from the use of short-term
debt as a funding source to meet scheduled maturities of long-term debt, as well
as cash needs, which can fluctuate due to the seasonality of its business.
CREDIT FACILITIES AND REGISTRATION STATEMENTS
Master Credit Facility Summary
Duke Energy has a master credit facility with a capacity of $6 billion through
December 2018. The Subsidiary Registrants, excluding Progress Energy each
have borrowing capacity under the master credit facility up to specified sublimits
for each borrower. Duke Energy has the unilateral ability at any time to increase
or decrease the borrowing sublimits of each borrower, subject to a maximum
sublimit for each borrower. The amount available under the master credit facility
has been reduced to backstop the issuances of commercial paper, certain letters
of credit and variable-rate demand tax-exempt bonds that may be put to the Duke
Energy Registrants at the option of the holder. The table below includes the current
borrowing sublimits and available capacity under the master credit facility.
December 31, 2013
(in millions)
Duke
Energy
Duke
Energy
(Parent)
Duke
Energy
Carolinas
Duke
Energy
Progress
Duke
Energy
Florida
Duke
Energy
Ohio
Duke
Energy
Indiana
Facility Size(a) $ 6,000 $ 2,250 $ 1,000 $ 750 $ 650 $ 650 $ 700
Reduction to backstop issuances
Notes payable and commercial paper(b) (450) — (300) — — — (150)
Outstanding letters of credit (62) (55) (4) (2) (1) — —
Tax-exempt bonds (240) — (75) — — (84) (81)
Available capacity $ 5,248 $ 2,195 $ 621 $ 748 $ 649 $ 566 $ 469
(a) Represents the sublimit of each borrower at December 31, 2013. The Duke Energy Ohio sublimit includes $100 million for Duke Energy Kentucky.
(b) Duke Energy issued $450 million of commercial paper and loaned the proceeds through the money pool to Duke Energy Carolinas and Duke Energy Indiana. The balances are classified as long-term borrowings within Long-
term Debt in Duke Energy Carolinas’ and Duke Energy Indiana’s Condensed Consolidated Balance Sheets.