Duke Energy 2013 Annual Report Download - page 48
Download and view the complete annual report
Please find page 48 of the 2013 Duke Energy annual report below. You can navigate through the pages in the report by either clicking on the pages listed below, or by using the keyword search tool below to find specific information within the annual report.-
 1
1 -
2
-
3
-
4
-
5
-
6
-
7
-
8
-
9
-
10
-
11
-
12
-
13
-
14
-
15
-
16
-
17
-
18
-
19
-
20
-
21
-
22
-
23
-
24
-
25
-
26
-
27
-
28
-
29
-
30
-
31
-
32
-
33
-
34
-
35
-
36
-
37
-
 38
38 -
 39
39 -
 40
40 -
 41
41 -
 42
42 -
 43
43 -
 44
44 -
 45
45 -
 46
46 -
 47
47 -
 48
48 -
 49
49 -
 50
50 -
 51
51 -
 52
52 -
 53
53 -
 54
54 -
 55
55 -
 56
56 -
 57
57 -
 58
58 -
59
-
60
-
61
-
62
-
63
-
64
-
65
-
66
-
67
-
68
-
69
-
70
-
71
-
72
-
73
-
74
-
75
-
76
-
77
-
78
-
79
-
80
-
81
-
82
-
83
-
84
-
85
-
86
-
87
-
88
-
89
-
90
-
91
-
92
-
93
-
94
-
95
-
96
-
97
-
98
-
99
-
100
-
101
-
102
-
103
-
104
-
105
-
106
-
107
-
108
-
109
-
110
-
111
-
112
-
113
-
114
-
115
-
116
-
117
-
118
-
119
-
120
-
121
-
122
-
123
-
124
-
125
-
126
-
127
-
128
-
129
-
130
-
131
-
132
-
133
-
134
-
135
-
136
-
137
-
138
-
139
-
140
-
141
-
142
-
143
-
144
-
145
-
146
-
147
-
148
-
149
-
150
-
151
-
152
-
153
-
154
-
155
-
156
-
157
-
158
-
159
-
160
-
161
-
162
-
163
-
164
-
165
-
166
-
167
-
168
-
169
-
170
-
171
-
172
-
173
-
174
-
175
-
176
-
177
-
178
-
179
-
180
-
181
-
182
-
183
-
184
-
185
-
186
-
187
-
188
-
189
-
190
-
191
-
192
-
193
-
194
-
195
-
196
-
197
-
198
-
199
-
200
-
201
-
202
-
203
-
204
-
205
-
206
-
207
-
208
-
209
-
210
-
211
-
212
-
213
-
214
-
215
-
216
-
217
-
218
-
219
-
220
-
221
-
222
-
223
-
224
-
225
-
226
-
227
-
228
-
229
-
230
-
231
-
232
-
233
-
234
-
235
-
236
-
237
-
238
-
239
-
240
-
241
-
242
-
243
-
244
-
245
-
246
-
247
-
248
-
249
-
250
-
251
-
252
-
253
-
254
-
255
-
256
-
257
-
258
-
259
 |
 |

30
PART II
Results of Operations
In this section, Duke Energy provides analysis and discussion of earnings
and factors affecting earnings on both a GAAP and non-GAAP basis.
Management evaluates financial performance in part based on the non-
GAAP financial measures, adjusted earnings and adjusted diluted earnings per
share (EPS). These items are measured as income from continuing operations
after deducting income attributable to noncontrolling interests, adjusted for the
dollar and per share impact of special items and mark-to-market impacts of
economic hedges in the Commercial Power segment. Special items represent
certain charges and credits, which management believes will not be recurring
on a regular basis, although it is reasonably possible such charges and credits
could recur. Mark-to-market adjustments reflect the impact of derivative
contracts, which are used in Duke Energy’s hedging of a portion of the economic
value of its generation assets in the Commercial Power segment. The mark-
to-market impact of derivative contracts is recognized in GAAP earnings
immediately as such derivative contracts do not qualify for hedge accounting
or regulatory treatment. The economic value of generation assets is subject
to fluctuations in fair value due to market price volatility of input and output
commodities (e.g. coal, electricity, natural gas). Economic hedging involves
both purchases and sales of those input and output commodities related to
generation assets. Operations of the generation assets are accounted for under
the accrual method. Management believes excluding impacts of mark-to-market
changes of the derivative contracts from adjusted earnings until settlement
better matches the financial impacts of the derivative contract with the portion
of economic value of the underlying hedged asset. Management believes the
presentation of adjusted earnings and adjusted diluted EPS provides useful
information to investors, as it provides them an additional relevant comparison
of Duke Energy’s performance across periods. Management uses these non-
GAAP financial measures for planning and forecasting and for reporting results
to the Board of Directors, employees, shareholders, analysts and investors
concerning Duke Energy’s financial performance. The most directly comparable
GAAP measures for adjusted earnings and adjusted diluted EPS are Net Income
Attributable to Duke Energy Corporation and Diluted EPS attributable to Duke
Energy Corporation common shareholders, which include the dollar and per
share impact of special items, mark-to-market impacts of economic hedges in
the Commercial Power segment and discontinued operations.
Management evaluates segment performance based on segment income.
Segment income is defined as income from continuing operations net of income
attributable to noncontrolling interests. Segment income, as discussed below,
includes intercompany revenues and expenses that are eliminated in the
Consolidated Financial Statements. Management also uses adjusted segment
income as a measure of historical and anticipated future segment performance.
Adjusted segment income is a non-GAAP financial measure, as it is based
upon segment income adjusted for special items and mark-to-market impacts
of economic hedges in the Commercial Power segment. Management believes
the presentation of adjusted segment income provides useful information to
investors, as it provides them with an additional relevant comparison of a
segment’s performance across periods. The most directly comparable GAAP
measure for adjusted segment income is segment income, which represents
segment income from continuing operations, including any special items and
mark-to-market impacts of economic hedges in the Commercial Power segment.
See Note 3 to the Consolidated Financial Statements, “Business
Segments,” for a discussion of Duke Energy’s segment structure.
OVERVIEW
The following table reconciles non-GAAP measures to the most directly comparable GAAP measure.
Year Ended December 31, 2013
(in millions, except per share amounts)
Regulated
Utilities
International
Energy
Commercial
Power
Total
Reportable
Segments Other
Duke
Energy
Per
Diluted
Share
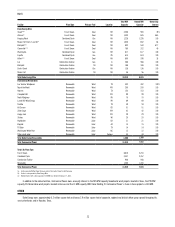
Adjusted segment income $ 2,776 $ 408 $ 15 $ 3,199 $ (128) $3,071 $ 4.35
Crystal River Unit 3 charges (215) — — (215) — (215) (0.31)
Costs to achieve Progress Energy merger — — — — (184) (184) (0.26)
Nuclear development charges (57) — — (57) — (57) (0.08)
Litigation reserve — — — — (14) (14) (0.02)
Economic hedges (Mark-to-market) — — (3) (3) — (3) (0.01)
Asset sales — — (15) (15) 65 50 0.07
Segment income (loss) $2,504 $ 408 $ (3) $ 2,909 $ (261) $2,648
Income from Discontinued Operations 17 0.02
Net Income Attributable to Duke Energy $2,665 $ 3.76
Year Ended December 31, 2012
(in millions, except per share amounts)
Regulated
Utilities
International
Energy
Commercial
Power
Total
Reportable
Segments Other
Duke
Energy
Per
Diluted
Share
Adjusted segment income $ 2,086 $ 439 $ 93 $ 2,618 $ (135) $2,483 $ 4.32
Edwardsport impairment and other charges (402) — — (402) — (402) (0.70)
Costs to achieve Progress Energy merger — — — — (397) (397) (0.70)
Economic hedges (Mark-to-market) — — (6) (6) — (6) (0.01)
Democratic National Convention Host Committee support — — — — (6) (6) (0.01)
Employee severance and office consolidation 60 — — 60 — 60 0.11
Segment income $ 1,744 $ 439 $ 87 $ 2,270 $ (538) 1,732
Income from Discontinued Operations 36 0.06
Net Income Attributable to Duke Energy $1,768 $ 3.07