Duke Energy 2013 Annual Report Download - page 197
Download and view the complete annual report
Please find page 197 of the 2013 Duke Energy annual report below. You can navigate through the pages in the report by either clicking on the pages listed below, or by using the keyword search tool below to find specific information within the annual report.-
 1
1 -
2
-
3
-
4
-
5
-
6
-
7
-
8
-
9
-
10
-
11
-
12
-
13
-
14
-
15
-
16
-
17
-
18
-
19
-
20
-
21
-
22
-
23
-
24
-
25
-
26
-
27
-
28
-
29
-
30
-
31
-
32
-
33
-
34
-
35
-
36
-
37
-
38
-
39
-
40
-
41
-
42
-
43
-
44
-
45
-
46
-
47
-
48
-
49
-
50
-
51
-
52
-
53
-
54
-
55
-
56
-
57
-
58
-
59
-
60
-
61
-
62
-
63
-
64
-
65
-
66
-
67
-
68
-
69
-
70
-
71
-
72
-
73
-
74
-
75
-
76
-
77
-
78
-
79
-
80
-
81
-
82
-
83
-
84
-
85
-
86
-
87
-
88
-
89
-
90
-
91
-
92
-
93
-
94
-
95
-
96
-
97
-
98
-
99
-
100
-
101
-
102
-
103
-
104
-
105
-
106
-
107
-
108
-
109
-
110
-
111
-
112
-
113
-
114
-
115
-
116
-
117
-
118
-
119
-
120
-
121
-
122
-
123
-
124
-
125
-
126
-
127
-
128
-
129
-
130
-
131
-
132
-
133
-
134
-
135
-
136
-
137
-
138
-
139
-
140
-
141
-
142
-
143
-
144
-
145
-
146
-
147
-
148
-
149
-
150
-
151
-
152
-
153
-
154
-
155
-
156
-
157
-
158
-
159
-
160
-
161
-
162
-
163
-
164
-
165
-
166
-
167
-
168
-
169
-
170
-
171
-
172
-
173
-
174
-
175
-
176
-
177
-
178
-
179
-
180
-
181
-
182
-
183
-
184
-
185
-
186
-
 187
187 -
 188
188 -
 189
189 -
 190
190 -
 191
191 -
 192
192 -
 193
193 -
 194
194 -
 195
195 -
 196
196 -
 197
197 -
 198
198 -
 199
199 -
 200
200 -
 201
201 -
 202
202 -
 203
203 -
 204
204 -
 205
205 -
 206
206 -
 207
207 -
208
-
209
-
210
-
211
-
212
-
213
-
214
-
215
-
216
-
217
-
218
-
219
-
220
-
221
-
222
-
223
-
224
-
225
-
226
-
227
-
228
-
229
-
230
-
231
-
232
-
233
-
234
-
235
-
236
-
237
-
238
-
239
-
240
-
241
-
242
-
243
-
244
-
245
-
246
-
247
-
248
-
249
-
250
-
251
-
252
-
253
-
254
-
255
-
256
-
257
-
258
-
259
 |
 |

179
PART II
DUKE ENERGY CORPORATION • DUKE ENERGY CAROLINAS, LLC • PROGRESS ENERGY, INC. •
DUKE ENERGY PROGRESS, INC. • DUKE ENERGY FLORIDA, INC. • DUKE ENERGY OHIO, INC. • DUKE ENERGY INDIANA, INC.
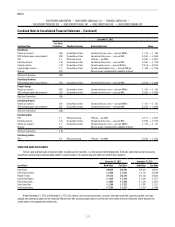
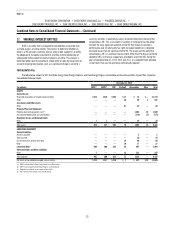
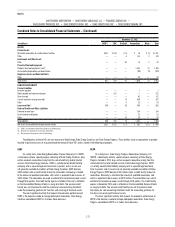
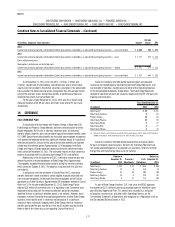
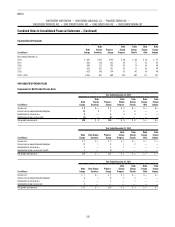
Combined Notes to Consolidated Financial Statements – (Continued)
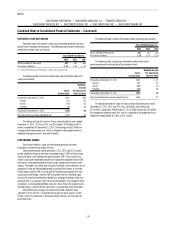
RESTRICTED STOCK UNIT AWARDS
Restricted stock unit awards issued and outstanding generally vest over
periods from immediate to three years. The following table includes information
related to restricted stock unit awards.
Years Ended December 31,
2013 2012 2011
Shares awarded (in thousands) 612 443 636
Fair value (in millions)(a) $ 42 $ 28 $ 34
(a) Based on the market price of Duke Energy’s common stock at the grant date.
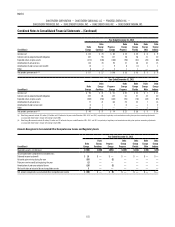
The following table summarizes information about restricted stock unit
awards outstanding.
Shares
(in thousands)
Weighted-
Average
Per Share Grant
Date Fair Value
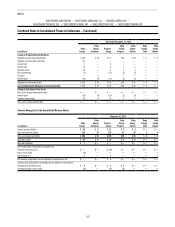
Outstanding at December 31, 2012 1,607 $64
Granted 612 69
Vested (794) 63
Forfeited (25) 68
Outstanding at December 31, 2013 1,400 66
Restricted stock unit awards expected to vest 1,365 66
The total grant date fair value of shares vested during the years ended
December 31, 2013, 2012 and 2011 was $50 million, $34 million and $19
million, respectively. At December 31, 2013, Duke Energy had $21 million of
unrecognized compensation cost, which is expected to be recognized over a
weighted-average period of 1 year and 9 months.
PERFORMANCE AWARDS
Stock-based awards issued and outstanding generally vest over
three years if performance targets are met.
Certain performance awards granted in 2013, 2012 and 2011 contain
market conditions based on the total shareholder return (TSR) of Duke Energy
stock relative to a pre-defined peer group (relative TSR). These awards are
valued using a path-dependent model that incorporates expected relative TSR
into the fair value determination of Duke Energy’s performance-based share
awards. The model uses three-year historical volatilities and correlations for all
companies in the pre-defined peer group, including Duke Energy, to simulate
Duke Energy’s relative TSR as of the end of the performance period. For each
simulation, Duke Energy’s relative TSR associated with the simulated stock
price at the end of the performance period plus expected dividends within the
period results in a value per share for the award portfolio. The average of these
simulations is the expected portfolio value per share. Actual life to date results
of Duke Energy’s relative TSR for each grant is incorporated within the model.
Other performance awards not containing market conditions were
awarded in 2012 and 2011. The performance goal for these awards is Duke
Energy’s return on equity over a three-year period. Awards are measured at
grant date price.
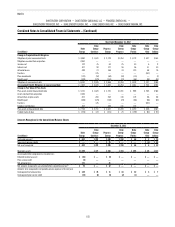
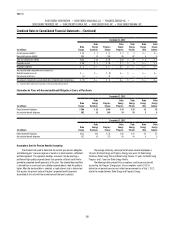
The following table includes information related to performance awards.
Years Ended December 31,
2013 2012 2011
Shares awarded (in thousands) 633 352 432
Fair value (in millions) $ 28 $ 19 $ 20
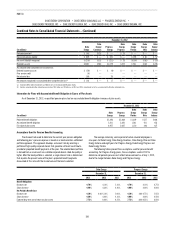
The following table summarizes information about stock-based
performance awards outstanding at the maximum level.
Shares
(in thousands)
Weighted-Average
Per Share Grant
Date Fair Value
Outstanding at December 31, 2012 2,346 $ 47
Granted 633 45
Vested (858) 49
Forfeited (299) 46
Outstanding at December 31, 2013 1,822 46
Stock-based performance awards expected to vest 1,646 47
The total grant date fair value of shares vested during the years ended
December 31, 2013, 2012 and 2011 was $42 million, $56 million and
$33 million, respectively. At December 31, 2013, Duke Energy had $22 million
of unrecognized compensation cost, which is expected to be recognized over a
weighted-average period of 1 year and 11 months.