Duke Energy 2013 Annual Report Download - page 47
Download and view the complete annual report
Please find page 47 of the 2013 Duke Energy annual report below. You can navigate through the pages in the report by either clicking on the pages listed below, or by using the keyword search tool below to find specific information within the annual report.-
 1
1 -
2
-
3
-
4
-
5
-
6
-
7
-
8
-
9
-
10
-
11
-
12
-
13
-
14
-
15
-
16
-
17
-
18
-
19
-
20
-
21
-
22
-
23
-
24
-
25
-
26
-
27
-
28
-
29
-
30
-
31
-
32
-
33
-
34
-
35
-
36
-
 37
37 -
 38
38 -
 39
39 -
 40
40 -
 41
41 -
 42
42 -
 43
43 -
 44
44 -
 45
45 -
 46
46 -
 47
47 -
 48
48 -
 49
49 -
 50
50 -
 51
51 -
 52
52 -
 53
53 -
 54
54 -
 55
55 -
 56
56 -
 57
57 -
58
-
59
-
60
-
61
-
62
-
63
-
64
-
65
-
66
-
67
-
68
-
69
-
70
-
71
-
72
-
73
-
74
-
75
-
76
-
77
-
78
-
79
-
80
-
81
-
82
-
83
-
84
-
85
-
86
-
87
-
88
-
89
-
90
-
91
-
92
-
93
-
94
-
95
-
96
-
97
-
98
-
99
-
100
-
101
-
102
-
103
-
104
-
105
-
106
-
107
-
108
-
109
-
110
-
111
-
112
-
113
-
114
-
115
-
116
-
117
-
118
-
119
-
120
-
121
-
122
-
123
-
124
-
125
-
126
-
127
-
128
-
129
-
130
-
131
-
132
-
133
-
134
-
135
-
136
-
137
-
138
-
139
-
140
-
141
-
142
-
143
-
144
-
145
-
146
-
147
-
148
-
149
-
150
-
151
-
152
-
153
-
154
-
155
-
156
-
157
-
158
-
159
-
160
-
161
-
162
-
163
-
164
-
165
-
166
-
167
-
168
-
169
-
170
-
171
-
172
-
173
-
174
-
175
-
176
-
177
-
178
-
179
-
180
-
181
-
182
-
183
-
184
-
185
-
186
-
187
-
188
-
189
-
190
-
191
-
192
-
193
-
194
-
195
-
196
-
197
-
198
-
199
-
200
-
201
-
202
-
203
-
204
-
205
-
206
-
207
-
208
-
209
-
210
-
211
-
212
-
213
-
214
-
215
-
216
-
217
-
218
-
219
-
220
-
221
-
222
-
223
-
224
-
225
-
226
-
227
-
228
-
229
-
230
-
231
-
232
-
233
-
234
-
235
-
236
-
237
-
238
-
239
-
240
-
241
-
242
-
243
-
244
-
245
-
246
-
247
-
248
-
249
-
250
-
251
-
252
-
253
-
254
-
255
-
256
-
257
-
258
-
259
 |
 |

29
PART II
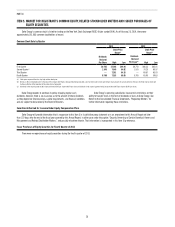
2013 FINANCIAL RESULTS
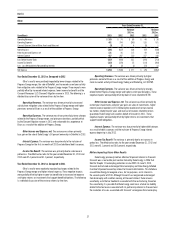
The following table summarizes adjusted earnings and net income
attributable to Duke Energy for the years ended December 31, 2013, 2012
and 2011.
Years Ended December 31,
2013 2012 2011
(in millions,
except per
share amounts) Amount
Per
diluted
share Amount
Per
diluted
share Amount
Per
diluted
share
Adjusted
earnings(a) $
3,071 $
4.35 $ 2,483 $ 4.32 $ 1,943 $ 4.38
Net income
attributable to
Duke Energy $
2,665 $
3.76 $ 1,768 $ 3.07 $ 1,706 $ 3.83
(a) See Results of Operations below for Duke Energy’s definition of adjusted earnings as well as a
reconciliation of this non-GAAP financial measure to net income attributable to Duke Energy.
Adjusted earnings increased from 2012 to 2013 primarily due to the
inclusion of a full year of Progress Energy results in 2013, the impact of the
revised rates, net of higher depreciation and amortization expense and lower
allowance for funds used during construction (AFUDC). Adjusted earnings
increased from 2011 to 2012 primarily due to the inclusion of Progress Energy’s
results beginning July 2012, and the impact of the 2011 Duke Energy Carolina’s
rate cases.
See “Results of Operations” below for a detailed discussion of the
consolidated results of operations, as well as a detailed discussion of financial
results for each of Duke Energy’s reportable business segments, as well as
Other.
2013 AREAS OF FOCUS AND ACCOMPLISHMENTS
In 2013, Duke Energy was focused on completing the fleet modernization
program, achieving constructive outcomes in its rate cases, resolving key
issues – including the future Crystal River Unit 3 nuclear station, improving
nuclear fleet performance, and realizing merger integration plans.
Completing the Fleet Modernization Program
During 2013, Duke Energy completed its $9 billion fleet modernization
program. This program added approximately 6,600 MW of new combined-cycle
natural gas and state-of-the-art coal capacity in North Carolina, South Carolina
and Indiana. This new generation will replace up to 6,700 MW of older coal and
oil plants, already retired or scheduled for retirement by 2015. The Edwardsport
IGCC and Sutton combined-cycle natural gas plant in Wilmington, North Carolina,
were placed in commercial service in June and November, respectively.
At Edwardsport, Duke Energy has been testing, tuning and optimizing the
unit. All major technology systems have been validated. Performance testing
was delayed in January by extreme weather, which also caused some equipment
issues that are being resolved. The Edwardsport IGCC project is expected to
achieve its full operational capabilities later this year and to be completed within
the revised cost estimate of $3.5 billion.
Achieving Constructive Outcomes in Rate Cases
Duke Energy reached constructive regulatory outcomes in all five of its
general rate cases to recover investments made to modernize its fleet. When
fully implemented, the base rate cases will add approximately $600 million
in annualized revenues, while keeping customers’ retail priced below national
averages.
Resolving Key Issues
Duke Energy also made the decision to retire Crystal River Unit 3, resolved
insurance claims with its insurance provider, Nuclear Electric Insurance Limited
(NEIL), and obtained approval from the FPSC of a comprehensive settlement.
This settlement agreement addressed cost recovery of the nuclear unit, Crystal
River 1 and 2 coal units, and the proposed Levy Nuclear Station (Levy). The
settlement agreement also provides for new generation in the latter half of this
decade to meet customer demand.
Improving Nuclear Fleet Performance
In 2013, Duke Energy’s nuclear fleet achieved a capacity factor of
92.8 percent, the 15th consecutive year with a capacity factor over 90 percent.
Duke Energy has made targeted investments at nuclear stations to bring the
entire fleet to consistent level of excellent performance. In particular, the
Robinson Nuclear Station (Robinson) completed a record continuous run of
531 days before beginning a scheduled refueling outage in September. This
complemented the record of continuous runs achieved at Oconee Nuclear Station
Unit 2 and Unit 3.
Realizing Merger Integration Plans
Duke Energy expects to exceed its original targets for fuel and joint-
dispatch savings, which benefit customers in North Carolina and South Carolina.
Through 2013, Duke Energy has recorded approximately $190 million of
cumulative fuel and joint-dispatch savings since the merger closed. In addition,
approximately 65 percent of the total guaranteed savings of $687 million have
been contractually locked-in or generated.
Duke Energy is also realizing cost synergies by eliminating duplicative
functions and has exceeded the original target of five to seven percent in
non-fuel operating and maintenance savings. Duke Energy is on pace to deliver
about nine percent, or approximately $550 million, of non-fuel operating and
maintenance expense in 2014.
2014 OBJECTIVES
Duke Energy is dedicated to the energy experience that customers value
and trust. Duke Energy strives for leadership and excellence that benefit
customers, shareholders and employees. Objectives for 2014 are:
• Continue to grow a zero-injury culture and deliver top-decile safety results,
• Develop and engage employees,
• Deliver new value by improving the customer experience and advancing
more flexible regulatory models,
• Establish a rigorous process for managing business and financial
performance to deliver customer value at a competitive price,
• Successfully complete 2014 integration milestones and continue
innovative use of technology to deliver value,
• Achieve 2014 financial goals, including delivering adjusted diluted EPS
guidance range of $4.45 - $4.60, and advance viable future growth
opportunities for regulated and nonregulated businesses, and
• Serve as a respected leading voice in helping to shape national and
state energy policies.
Due to the forward-looking nature of the adjusted diluted EPS range, information
to reconcile this non-GAAP financial measure to the most directly comparable
GAAP financial measure is not available at this time, as Duke Energy is unable
to forecast all special items, the mark-to-market impacts of economic hedges
in the Commercial Power segment, or any amounts that may be reported as
discontinued operations or extraordinary items for future periods.