Duke Energy 2013 Annual Report Download - page 226
Download and view the complete annual report
Please find page 226 of the 2013 Duke Energy annual report below. You can navigate through the pages in the report by either clicking on the pages listed below, or by using the keyword search tool below to find specific information within the annual report.-
 1
1 -
2
-
3
-
4
-
5
-
6
-
7
-
8
-
9
-
10
-
11
-
12
-
13
-
14
-
15
-
16
-
17
-
18
-
19
-
20
-
21
-
22
-
23
-
24
-
25
-
26
-
27
-
28
-
29
-
30
-
31
-
32
-
33
-
34
-
35
-
36
-
37
-
38
-
39
-
40
-
41
-
42
-
43
-
44
-
45
-
46
-
47
-
48
-
49
-
50
-
51
-
52
-
53
-
54
-
55
-
56
-
57
-
58
-
59
-
60
-
61
-
62
-
63
-
64
-
65
-
66
-
67
-
68
-
69
-
70
-
71
-
72
-
73
-
74
-
75
-
76
-
77
-
78
-
79
-
80
-
81
-
82
-
83
-
84
-
85
-
86
-
87
-
88
-
89
-
90
-
91
-
92
-
93
-
94
-
95
-
96
-
97
-
98
-
99
-
100
-
101
-
102
-
103
-
104
-
105
-
106
-
107
-
108
-
109
-
110
-
111
-
112
-
113
-
114
-
115
-
116
-
117
-
118
-
119
-
120
-
121
-
122
-
123
-
124
-
125
-
126
-
127
-
128
-
129
-
130
-
131
-
132
-
133
-
134
-
135
-
136
-
137
-
138
-
139
-
140
-
141
-
142
-
143
-
144
-
145
-
146
-
147
-
148
-
149
-
150
-
151
-
152
-
153
-
154
-
155
-
156
-
157
-
158
-
159
-
160
-
161
-
162
-
163
-
164
-
165
-
166
-
167
-
168
-
169
-
170
-
171
-
172
-
173
-
174
-
175
-
176
-
177
-
178
-
179
-
180
-
181
-
182
-
183
-
184
-
185
-
186
-
187
-
188
-
189
-
190
-
191
-
192
-
193
-
194
-
195
-
196
-
197
-
198
-
199
-
200
-
201
-
202
-
203
-
204
-
205
-
206
-
207
-
208
-
209
-
210
-
211
-
212
-
213
-
214
-
215
-
 216
216 -
 217
217 -
 218
218 -
 219
219 -
 220
220 -
 221
221 -
 222
222 -
 223
223 -
 224
224 -
 225
225 -
 226
226 -
 227
227 -
 228
228 -
 229
229 -
 230
230 -
 231
231 -
 232
232 -
 233
233 -
 234
234 -
 235
235 -
 236
236 -
237
-
238
-
239
-
240
-
241
-
242
-
243
-
244
-
245
-
246
-
247
-
248
-
249
-
250
-
251
-
252
-
253
-
254
-
255
-
256
-
257
-
258
-
259
 |
 |

208
PART II
DUKE ENERGY CORPORATION • DUKE ENERGY CAROLINAS, LLC • PROGRESS ENERGY, INC. •
DUKE ENERGY PROGRESS, INC. • DUKE ENERGY FLORIDA, INC. • DUKE ENERGY OHIO, INC. • DUKE ENERGY INDIANA, INC.
Combined Notes to Consolidated Financial Statements – (Continued)
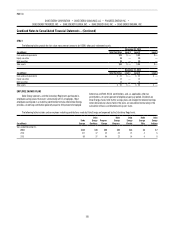
PROGRESS ENERGY
(in millions)
First
Quarter
Second
Quarter
Third
Quarter
Fourth
Quarter Total
2013
Operating revenues $2,186 $2,281 $2,766 $2,300 $ 9,533
Operating income 430 114 671 403 1,618
Income (loss) from continuing
operations 154 (13) 328 190 659
Net income (loss) 154 (17) 342 196 675
Net income (loss) attributable to Parent 153 (17) 341 195 672
2012
Operating revenues $2,102 $2,288 $2,788 $ 2,227 $ 9,405
Operating income 363 277 379 118 1,137
Income (loss) from continuing
operations 141 68 154 (8) 355
Net income 152 64 157 34 407
Net income attributable to Parent 150 63 155 32 400
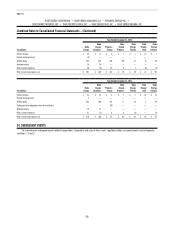
The following table includes unusual or infrequently occurring items in
each quarter during the two most recently completed fiscal years. All amounts
discussed below are pretax unless otherwise noted.
(in millions)
First
Quarter
Second
Quarter
Third
Quarter
Fourth
Quarter Total
2013(a)
Costs to achieve the merger with
Duke Energy (see Note 2) $(19) $ (33) $ (42) $ (28) $(122)
Crystal River Unit 3 charges
(see Note 4) — (295) — (57) (352)
Harris and Levy nuclear development
charges (see Note 4) — (87) — — (87)
Total $(19) $(415) $ (42) $ (85) $ (561)
2012
Costs to achieve the merger with Duke
Energy (see Note 2) $ (7) $ (20) $(217) $ (82) $ (326)
Florida replacement power refund
(see Note 4) — — (100) — (100)
Crystal River Unit 3 charges
(see Note 4) — — — (192) (192)
Total $ (7) $ (20) $(317) $(274) $ (618)
(a) Revised retail rates became effective in January in Florida and June in North Carolina (see Note 4 for
further information).
DUKE ENERGY PROGRESS
(in millions)
First
Quarter
Second
Quarter
Third
Quarter
Fourth
Quarter Total
2013
Operating revenues $1,216 $1,135 $1,430 $1,211 $ 4,992
Operating income 212 166 303 251 932
Net income 110 77 175 138 500
2012
Operating revenues $1,090 $1,090 $1,398 $1,128 $ 4,706
Operating income 107 83 172 148 510
Net income 52 31 96 93 272
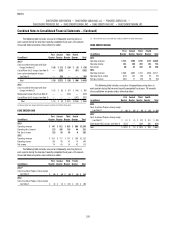
The following table includes unusual or infrequently occurring items
in each quarter during the two most recently completed fiscal years. All
amounts discussed below are pretax unless otherwise noted.
(in millions)
First
Quarter
Second
Quarter
Third
Quarter
Fourth
Quarter Total
2013(a)
Costs to achieve the merger with
Duke Energy (see Note 2) $ (11) $ (22) $ (32) $ (19) $ (84)
Harris nuclear development charges
(see Note 4) —(22) — — (22)
Total $ (11) $ (44) $ (32) $ (19) $ (106)
2012
Costs to achieve the merger with Duke
Energy (see Note 2) $ (4) $ (12) $ (180) $ (36) $ (232)
(a) Revised retail rates became effective in June in North Carolina (see Note 4 for further information).
DUKE ENERGY FLORIDA
(in millions)
First
Quarter
Second
Quarter
Third
Quarter
Fourth
Quarter Total
2013
Operating revenues $ 968 $1,142 $1,332 $1,085 $4,527
Operating income (loss) 221 (53) 369 151 688
Net income (loss) 110 (57) 197 75 325
2012
Operating revenues $1,010 $1,196 $1,388 $1,095 $4,689
Operating income (loss) 255 196 207 (29) 629
Net income (loss) 128 83 100 (45) 266