Duke Energy 2013 Annual Report Download - page 106
Download and view the complete annual report
Please find page 106 of the 2013 Duke Energy annual report below. You can navigate through the pages in the report by either clicking on the pages listed below, or by using the keyword search tool below to find specific information within the annual report.-
 1
1 -
2
-
3
-
4
-
5
-
6
-
7
-
8
-
9
-
10
-
11
-
12
-
13
-
14
-
15
-
16
-
17
-
18
-
19
-
20
-
21
-
22
-
23
-
24
-
25
-
26
-
27
-
28
-
29
-
30
-
31
-
32
-
33
-
34
-
35
-
36
-
37
-
38
-
39
-
40
-
41
-
42
-
43
-
44
-
45
-
46
-
47
-
48
-
49
-
50
-
51
-
52
-
53
-
54
-
55
-
56
-
57
-
58
-
59
-
60
-
61
-
62
-
63
-
64
-
65
-
66
-
67
-
68
-
69
-
70
-
71
-
72
-
73
-
74
-
75
-
76
-
77
-
78
-
79
-
80
-
81
-
82
-
83
-
84
-
85
-
86
-
87
-
88
-
89
-
90
-
91
-
92
-
93
-
94
-
95
-
 96
96 -
 97
97 -
 98
98 -
 99
99 -
 100
100 -
 101
101 -
 102
102 -
 103
103 -
 104
104 -
 105
105 -
 106
106 -
 107
107 -
 108
108 -
 109
109 -
 110
110 -
 111
111 -
 112
112 -
 113
113 -
 114
114 -
 115
115 -
 116
116 -
117
-
118
-
119
-
120
-
121
-
122
-
123
-
124
-
125
-
126
-
127
-
128
-
129
-
130
-
131
-
132
-
133
-
134
-
135
-
136
-
137
-
138
-
139
-
140
-
141
-
142
-
143
-
144
-
145
-
146
-
147
-
148
-
149
-
150
-
151
-
152
-
153
-
154
-
155
-
156
-
157
-
158
-
159
-
160
-
161
-
162
-
163
-
164
-
165
-
166
-
167
-
168
-
169
-
170
-
171
-
172
-
173
-
174
-
175
-
176
-
177
-
178
-
179
-
180
-
181
-
182
-
183
-
184
-
185
-
186
-
187
-
188
-
189
-
190
-
191
-
192
-
193
-
194
-
195
-
196
-
197
-
198
-
199
-
200
-
201
-
202
-
203
-
204
-
205
-
206
-
207
-
208
-
209
-
210
-
211
-
212
-
213
-
214
-
215
-
216
-
217
-
218
-
219
-
220
-
221
-
222
-
223
-
224
-
225
-
226
-
227
-
228
-
229
-
230
-
231
-
232
-
233
-
234
-
235
-
236
-
237
-
238
-
239
-
240
-
241
-
242
-
243
-
244
-
245
-
246
-
247
-
248
-
249
-
250
-
251
-
252
-
253
-
254
-
255
-
256
-
257
-
258
-
259
 |
 |

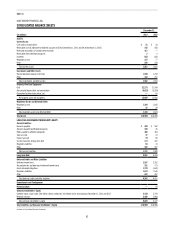
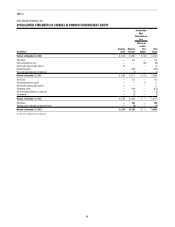
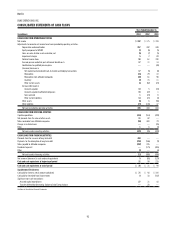
88
PART II
DUKE ENERGY FLORIDA, INC.
STATEMENTS OF CASH FLOWS
Years Ended December 31,
(in millions) 2013 2012 2011
CASH FLOWS FROM OPERATING ACTIVITIES
Net income $ 325 $ 266 $ 314
Adjustments to reconcile net income to net cash provided by operating activities:
Depreciation, amortization and accretion 335 197 174
Equity component of AFUDC (8) (37) (32)
Severance expense — 6 —
Gains on sales of other assets and other, net (1) (2) (2)
Impairment charges 358 146 —
Deferred income taxes 368 142 234
Amount to be refunded to customers — 100 288
Accrued pension and other post-retirement benefit costs 79 71 52
Contributions to qualified pension plans (133) (128) (112)
(Increase) decrease in
Net realized and unrealized mark-to-market and hedging transactions 55 73 (13)
Receivables (44) 37 91
Receivables from affiliated companies 17 (13) (6)
Inventory 42 (13) (28)
Other current assets (109) 22 (160)
Increase (decrease) in
Accounts payable (22) 21 (45)
Accounts payable to affiliated companies (6) 30 (37)
Taxes accrued 18 15 (8)
Other current liabilities 159 51 16
Other assets (154) 8 (7)
Other liabilities (74) (94) 46
Net cash provided by operating activities 1,205 898 765
CASH FLOWS FROM INVESTING ACTIVITIES
Capital expenditures (915) (809) (813)
Purchases of available-for-sale securities (1,656) (791) (4,435)
Proceeds from sales and maturities of available-for-sale securities 1,658 791 4,438
Insurance proceeds — 7 76
Notes receivable from affiliated companies 207 (207) —
Other — 9 27
Net cash used in investing activities (706) (1,000) (707)
CASH FLOWS FROM FINANCING ACTIVITIES
Proceeds from the issuance of long-term debt — 642 296
Payments for the:
Redemption of long-term debt (435) (10) (309)
Redemption of preferred stock (34) — —
Payments of short-term debt with original maturities greater than 90 days — (65) —
Proceeds from issuance of short-term debt with original maturities greater than 90 days — 65 —
Notes payable and commercial paper — (233) 233
Notes payable to affiliated companies 181 (8) —
Dividends to parent (325) (170) (510)
Dividends paid on preferred stock — (2) (2)
Other (1) (2) 1
Net cash (used in) provided by financing activities (614) 217 (291)
Net (decrease) increase in cash and cash equivalents (115) 115 (233)
Cash and Cash Equivalents at Beginning of Period 131 16 249
Cash and Cash Equivalents at End of Period $ 16 $ 131 $ 16
Supplemental Disclosures:
Cash paid for interest, net of amount capitalized $ 201 $ 266 $ 287
Cash (received from) paid for income taxes (84) 24 (83)
Significant non-cash transactions:
Accrued capital expenditures 88 139 106
Asset retirement obligation additions — 139 —
See Notes to Consolidated Financial Statements