Duke Energy 2013 Annual Report Download - page 132
Download and view the complete annual report
Please find page 132 of the 2013 Duke Energy annual report below. You can navigate through the pages in the report by either clicking on the pages listed below, or by using the keyword search tool below to find specific information within the annual report.-
 1
1 -
2
-
3
-
4
-
5
-
6
-
7
-
8
-
9
-
10
-
11
-
12
-
13
-
14
-
15
-
16
-
17
-
18
-
19
-
20
-
21
-
22
-
23
-
24
-
25
-
26
-
27
-
28
-
29
-
30
-
31
-
32
-
33
-
34
-
35
-
36
-
37
-
38
-
39
-
40
-
41
-
42
-
43
-
44
-
45
-
46
-
47
-
48
-
49
-
50
-
51
-
52
-
53
-
54
-
55
-
56
-
57
-
58
-
59
-
60
-
61
-
62
-
63
-
64
-
65
-
66
-
67
-
68
-
69
-
70
-
71
-
72
-
73
-
74
-
75
-
76
-
77
-
78
-
79
-
80
-
81
-
82
-
83
-
84
-
85
-
86
-
87
-
88
-
89
-
90
-
91
-
92
-
93
-
94
-
95
-
96
-
97
-
98
-
99
-
100
-
101
-
102
-
103
-
104
-
105
-
106
-
107
-
108
-
109
-
110
-
111
-
112
-
113
-
114
-
115
-
116
-
117
-
118
-
119
-
120
-
121
-
 122
122 -
 123
123 -
 124
124 -
 125
125 -
 126
126 -
 127
127 -
 128
128 -
 129
129 -
 130
130 -
 131
131 -
 132
132 -
 133
133 -
 134
134 -
 135
135 -
 136
136 -
 137
137 -
 138
138 -
 139
139 -
 140
140 -
 141
141 -
 142
142 -
143
-
144
-
145
-
146
-
147
-
148
-
149
-
150
-
151
-
152
-
153
-
154
-
155
-
156
-
157
-
158
-
159
-
160
-
161
-
162
-
163
-
164
-
165
-
166
-
167
-
168
-
169
-
170
-
171
-
172
-
173
-
174
-
175
-
176
-
177
-
178
-
179
-
180
-
181
-
182
-
183
-
184
-
185
-
186
-
187
-
188
-
189
-
190
-
191
-
192
-
193
-
194
-
195
-
196
-
197
-
198
-
199
-
200
-
201
-
202
-
203
-
204
-
205
-
206
-
207
-
208
-
209
-
210
-
211
-
212
-
213
-
214
-
215
-
216
-
217
-
218
-
219
-
220
-
221
-
222
-
223
-
224
-
225
-
226
-
227
-
228
-
229
-
230
-
231
-
232
-
233
-
234
-
235
-
236
-
237
-
238
-
239
-
240
-
241
-
242
-
243
-
244
-
245
-
246
-
247
-
248
-
249
-
250
-
251
-
252
-
253
-
254
-
255
-
256
-
257
-
258
-
259
 |
 |

114
PART II
DUKE ENERGY CORPORATION • DUKE ENERGY CAROLINAS, LLC • PROGRESS ENERGY, INC. •
DUKE ENERGY PROGRESS, INC. • DUKE ENERGY FLORIDA, INC. • DUKE ENERGY OHIO, INC. • DUKE ENERGY INDIANA, INC.
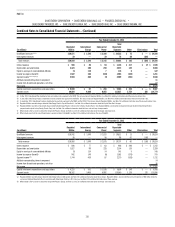
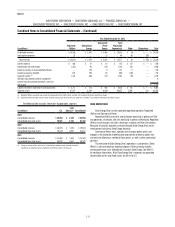
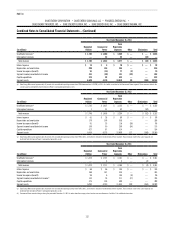
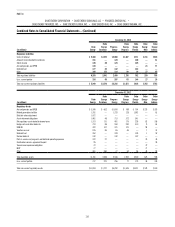
Combined Notes to Consolidated Financial Statements – (Continued)
December 31, 2013
(in millions)
Duke
Energy
Duke
Energy
Carolinas
Progress
Energy
Duke
Energy
Progress
Duke
Energy
Florida
Duke
Energy
Ohio
Duke
Energy
Indiana
Regulatory Liabilities
Costs of removal $ 5,308 $2,423 $2,008 $1,637 $ 371 $ 241 $645
Amounts to be refunded to customers 151 — 120 — 120 — 31
Storm reserve 145 20 125 — 125 — —
Accrued pension and OPEB 138 — — — — 21 77
Deferred fuel 177 45 132 — 132 — —
Other 346 153 114 99 14 27 45
Total regulatory liabilities 6,265 2,641 2,499 1,736 762 289 798
Less: current portion 316 65 207 63 144 27 16
Total non-current regulatory liabilities $ 5,949 $2,576 $2,292 $1,673 $ 618 $ 262 $782
December 31, 2012
(in millions)
Duke
Energy
Duke
Energy
Carolinas
Progress
Energy
Duke
Energy
Progress
Duke
Energy
Florida
Duke
Energy
Ohio
Duke
Energy
Indiana
Regulatory Assets
Accrued pension and OPEB $3,306 $602 $1,650 $769 $754 $225 $325
Retired generation facilities 1,781 —1,720 128 1,592 — 61
Debt fair value adjustment 1,472 — — — — — —
Asset retirement obligations 1,461 48 713 372 341 — —
Net regulatory asset related to income taxes 1,373 731 401 175 226 82 158
Hedge costs and other deferrals 710 88 550 240 310 9 63
DSM/EE 322 107 121 121 — 94 —
Vacation accrual 245 85 65 65 —7 13
Deferred fuel 162 — 109 — 109 1 52
Nuclear deferral 142 — 142 — 142 — —
Post-in-service carrying costs and deferred operating expenses 122 27 — — — 19 76
Gasication services agreement buyout 95 — — — — — 95
Transmission expansion obligation 72 — — — — 72 —
MGP 77 — — — — 77 —
Other 401 260 77 52 26 39 93
Total regulatory assets 11,741 1,948
5,548 1,922
3,500 625 936
Less: current portion 737 221 256 77 179 46 126
Total non-current regulatory assets $11,004 $1,727 $
5,292 $1,845 $
3,321 $579 $810