Duke Energy 2013 Annual Report Download - page 116
Download and view the complete annual report
Please find page 116 of the 2013 Duke Energy annual report below. You can navigate through the pages in the report by either clicking on the pages listed below, or by using the keyword search tool below to find specific information within the annual report.-
 1
1 -
2
-
3
-
4
-
5
-
6
-
7
-
8
-
9
-
10
-
11
-
12
-
13
-
14
-
15
-
16
-
17
-
18
-
19
-
20
-
21
-
22
-
23
-
24
-
25
-
26
-
27
-
28
-
29
-
30
-
31
-
32
-
33
-
34
-
35
-
36
-
37
-
38
-
39
-
40
-
41
-
42
-
43
-
44
-
45
-
46
-
47
-
48
-
49
-
50
-
51
-
52
-
53
-
54
-
55
-
56
-
57
-
58
-
59
-
60
-
61
-
62
-
63
-
64
-
65
-
66
-
67
-
68
-
69
-
70
-
71
-
72
-
73
-
74
-
75
-
76
-
77
-
78
-
79
-
80
-
81
-
82
-
83
-
84
-
85
-
86
-
87
-
88
-
89
-
90
-
91
-
92
-
93
-
94
-
95
-
96
-
97
-
98
-
99
-
100
-
101
-
102
-
103
-
104
-
105
-
 106
106 -
 107
107 -
 108
108 -
 109
109 -
 110
110 -
 111
111 -
 112
112 -
 113
113 -
 114
114 -
 115
115 -
 116
116 -
 117
117 -
 118
118 -
 119
119 -
 120
120 -
 121
121 -
 122
122 -
 123
123 -
 124
124 -
 125
125 -
 126
126 -
127
-
128
-
129
-
130
-
131
-
132
-
133
-
134
-
135
-
136
-
137
-
138
-
139
-
140
-
141
-
142
-
143
-
144
-
145
-
146
-
147
-
148
-
149
-
150
-
151
-
152
-
153
-
154
-
155
-
156
-
157
-
158
-
159
-
160
-
161
-
162
-
163
-
164
-
165
-
166
-
167
-
168
-
169
-
170
-
171
-
172
-
173
-
174
-
175
-
176
-
177
-
178
-
179
-
180
-
181
-
182
-
183
-
184
-
185
-
186
-
187
-
188
-
189
-
190
-
191
-
192
-
193
-
194
-
195
-
196
-
197
-
198
-
199
-
200
-
201
-
202
-
203
-
204
-
205
-
206
-
207
-
208
-
209
-
210
-
211
-
212
-
213
-
214
-
215
-
216
-
217
-
218
-
219
-
220
-
221
-
222
-
223
-
224
-
225
-
226
-
227
-
228
-
229
-
230
-
231
-
232
-
233
-
234
-
235
-
236
-
237
-
238
-
239
-
240
-
241
-
242
-
243
-
244
-
245
-
246
-
247
-
248
-
249
-
250
-
251
-
252
-
253
-
254
-
255
-
256
-
257
-
258
-
259
 |
 |

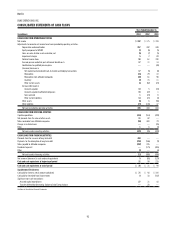
98
PART II
DUKE ENERGY INDIANA, INC.
CONSOLIDATED STATEMENTS OF CASH FLOWS
Years Ended December 31,
(in millions) 2013 2012 2011
CASH FLOWS FROM OPERATING ACTIVITIES
Net income (loss) $ 358 $ (50) $ 168
Adjustments to reconcile net income (loss) to net cash provided by operating activities:
Depreciation and amortization 346 393 395
Equity component of AFUDC (15) (84) (88)
Impairment charges — 579 234
Deferred income taxes 304 (74) (63)
Accrued pension and other post-retirement benefit costs 25 15 23
Contributions to qualified pension plans — — (52)
(Increase) decrease in
Net realized and unrealized mark-to-market and hedging transactions (30) — —
Receivables 3 6 25
Receivables from affiliated companies (47) 52 63
Inventory (53) (50) (64)
Other current assets (40) (25) 13
Increase (decrease) in
Accounts payable 32 18 (14)
Accounts payable to affiliated companies (4) (12) 5
Taxes accrued (30) (27) 29
Other current liabilities (5) 6 (16)
Other assets (16) 6 47
Other liabilities (84) (37) (72)
Net cash provided by operating activities 744 716 633
CASH FLOWS FROM INVESTING ACTIVITIES
Capital expenditures (545) (718) (1,066)
Purchases of available-for-sale securities (11) (17) (11)
Proceeds from sales and maturities of available-for-sale securities 7 18 8
Notes receivable from affiliated companies (96) — 115
Change in restricted cash — — 6
Other (3) (1) (5)
Net cash used in investing activities (648) (718) (953)
CASH FLOWS FROM FINANCING ACTIVITIES
Proceeds from the issuance of long-term debt 498 250 —
Payments for the redemption of long-term debt (405) (7) (14)
Notes payable to affiliated companies (81) (219) 300
Dividend to parent (125) — —
Other (4) (2) (4)
Net cash (used in) provided by financing activities (117) 22 282
Net (decrease) increase in cash and cash equivalents (21) 20 (38)
Cash and cash equivalents at beginning of period 36 16 54
Cash and cash equivalents at end of period $ 15 $ 36 $ 16
Supplemental Disclosures:
Cash paid for interest, net of amount capitalized $ 194 $ 130 $ 130
Cash paid for income taxes 46 57 90
Significant non-cash transactions:
Accrued capital expenditures 73 67 110
Transfer of Vermillion Generating Station from Duke Energy Ohio — 26 —
See Notes to Consolidated Financial Statements