Duke Energy 2013 Annual Report Download - page 163
Download and view the complete annual report
Please find page 163 of the 2013 Duke Energy annual report below. You can navigate through the pages in the report by either clicking on the pages listed below, or by using the keyword search tool below to find specific information within the annual report.-
 1
1 -
2
-
3
-
4
-
5
-
6
-
7
-
8
-
9
-
10
-
11
-
12
-
13
-
14
-
15
-
16
-
17
-
18
-
19
-
20
-
21
-
22
-
23
-
24
-
25
-
26
-
27
-
28
-
29
-
30
-
31
-
32
-
33
-
34
-
35
-
36
-
37
-
38
-
39
-
40
-
41
-
42
-
43
-
44
-
45
-
46
-
47
-
48
-
49
-
50
-
51
-
52
-
53
-
54
-
55
-
56
-
57
-
58
-
59
-
60
-
61
-
62
-
63
-
64
-
65
-
66
-
67
-
68
-
69
-
70
-
71
-
72
-
73
-
74
-
75
-
76
-
77
-
78
-
79
-
80
-
81
-
82
-
83
-
84
-
85
-
86
-
87
-
88
-
89
-
90
-
91
-
92
-
93
-
94
-
95
-
96
-
97
-
98
-
99
-
100
-
101
-
102
-
103
-
104
-
105
-
106
-
107
-
108
-
109
-
110
-
111
-
112
-
113
-
114
-
115
-
116
-
117
-
118
-
119
-
120
-
121
-
122
-
123
-
124
-
125
-
126
-
127
-
128
-
129
-
130
-
131
-
132
-
133
-
134
-
135
-
136
-
137
-
138
-
139
-
140
-
141
-
142
-
143
-
144
-
145
-
146
-
147
-
148
-
149
-
150
-
151
-
152
-
 153
153 -
 154
154 -
 155
155 -
 156
156 -
 157
157 -
 158
158 -
 159
159 -
 160
160 -
 161
161 -
 162
162 -
 163
163 -
 164
164 -
 165
165 -
 166
166 -
 167
167 -
 168
168 -
 169
169 -
 170
170 -
 171
171 -
 172
172 -
 173
173 -
174
-
175
-
176
-
177
-
178
-
179
-
180
-
181
-
182
-
183
-
184
-
185
-
186
-
187
-
188
-
189
-
190
-
191
-
192
-
193
-
194
-
195
-
196
-
197
-
198
-
199
-
200
-
201
-
202
-
203
-
204
-
205
-
206
-
207
-
208
-
209
-
210
-
211
-
212
-
213
-
214
-
215
-
216
-
217
-
218
-
219
-
220
-
221
-
222
-
223
-
224
-
225
-
226
-
227
-
228
-
229
-
230
-
231
-
232
-
233
-
234
-
235
-
236
-
237
-
238
-
239
-
240
-
241
-
242
-
243
-
244
-
245
-
246
-
247
-
248
-
249
-
250
-
251
-
252
-
253
-
254
-
255
-
256
-
257
-
258
-
259
 |
 |

145
PART II
DUKE ENERGY CORPORATION • DUKE ENERGY CAROLINAS, LLC • PROGRESS ENERGY, INC. •
DUKE ENERGY PROGRESS, INC. • DUKE ENERGY FLORIDA, INC. • DUKE ENERGY OHIO, INC. • DUKE ENERGY INDIANA, INC.
Combined Notes to Consolidated Financial Statements – (Continued)
December 31, 2012
Duke
Energy
Duke
Energy
Carolinas
Progress
Energy
Duke
Energy
Progress
Duke
Energy
Florida
Duke
Energy
Ohio
Duke
Energy
Indiana
Electricity (Gigawatt-hours)(a) 52,104 2,028 1,850 1,850 — 51,215 97
Natural gas (millions of decatherms) 528 — 348 118 230 180 —
(a) Amounts at Duke Energy Ohio include intercompany positions that eliminate at Duke Energy.
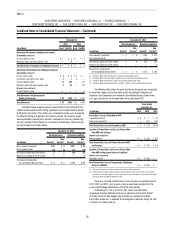
INTEREST RATE RISK
The Duke Energy Registrants are exposed to changes in interest rates
as a result of their issuance or anticipated issuance of variable-rate and
fixed-rate debt and commercial paper. Interest rate risk is managed by limiting
variable-rate exposures to a percentage of total debt and by monitoring
changes in interest rates. To manage risk associated with changes in interest
rates, the Duke Energy Registrants may enter into interest rate swaps,
U.S. Treasury lock agreements, and other financial contracts. In anticipation
of certain fixed-rate debt issuances, a series of forward starting interest rate
swaps may be executed to lock in components of current market interest
rates. These instruments are later terminated prior to or upon the issuance of
the corresponding debt. Pretax gains or losses recognized from inception to
termination of the hedges are amortized as a component of interest expense
over the life of the debt.
Duke Energy has a combination foreign exchange, pay fixed-receive
floating interest rate swap to fix the US dollar equivalent payments on a
floating-rate Chilean debt issue.
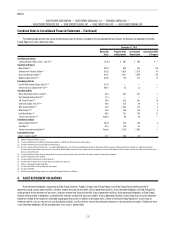
The following tables show notional amounts for derivatives related to interest rate risk.
December 31, 2013 December 31, 2012
(in millions)
Duke
Energy
Duke
Energy
Ohio
Duke
Energy
Progress
Energy
Duke
Energy
Progress
Duke
Energy
Ohio
Duke
Energy
Indiana
Cash flow hedges(a) $ 798 $ — $ 1,047 $ — $ — $ — $ —
Undesignated contracts 34 27 290 50 50 27 200
Fair value hedges — — 250 — — 250 —
Total notional amount $ 832 $ 27 $ 1,587 $ 50 $ 50 $ 277 $ 200
(a) Duke Energy includes amounts related to non-recourse variable rate long-term debt of VIEs of $584 million at December 31, 2013 and $620 million at December 31, 2012.
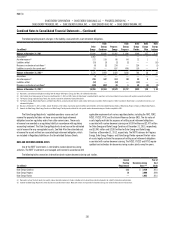
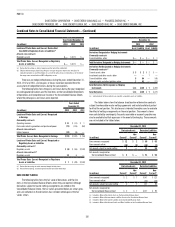
DUKE ENERGY
The following table shows the fair value of derivatives and the line
items in the Consolidated Balance Sheets where they are reported. Although
derivatives subject to master netting arrangements are netted on the
Consolidated Balance Sheets, the fair values presented below are shown gross
and cash collateral on the derivatives has not been netted against the fair
values shown.
December 31,
2013 2012
(in millions) Asset Liability Asset Liability
Derivatives Designated as Hedging Instruments
Commodity contracts
Current liabilities: other $ — $ 1 $ — $ 2
Deferred credits and other liabilities: other — — — 1
Interest rate contracts
Current assets: other — — 2 —
Investments and other assets: other 27 — 7 —
Current liabilities: Other — 18 — 81
Deferred credits and other liabilities: other — 4 — 35
Total Derivatives Designated as Hedging Instruments $ 27 $ 23 $ 9 $ 119
Derivatives Not Designated as Hedging Instruments
Commodity contracts
Current assets: other $ 201 $158 $ 41 $ 2
Investments and other assets: other 215 131 106 50
Current liabilities: other 13 153 106 407
Deferred credits and other liabilities: other 5 166 2 255
Interest rate contracts
Current liabilities: other — 1 — 76
Deferred credits and other liabilities: other — 4 — 8
Total Derivatives Not Designated as Hedging
Instruments $ 434 $613 $ 255 $ 798
Total Derivatives $ 461 $636 $ 264 $ 917