Duke Energy 2013 Annual Report Download - page 156
Download and view the complete annual report
Please find page 156 of the 2013 Duke Energy annual report below. You can navigate through the pages in the report by either clicking on the pages listed below, or by using the keyword search tool below to find specific information within the annual report.-
 1
1 -
2
-
3
-
4
-
5
-
6
-
7
-
8
-
9
-
10
-
11
-
12
-
13
-
14
-
15
-
16
-
17
-
18
-
19
-
20
-
21
-
22
-
23
-
24
-
25
-
26
-
27
-
28
-
29
-
30
-
31
-
32
-
33
-
34
-
35
-
36
-
37
-
38
-
39
-
40
-
41
-
42
-
43
-
44
-
45
-
46
-
47
-
48
-
49
-
50
-
51
-
52
-
53
-
54
-
55
-
56
-
57
-
58
-
59
-
60
-
61
-
62
-
63
-
64
-
65
-
66
-
67
-
68
-
69
-
70
-
71
-
72
-
73
-
74
-
75
-
76
-
77
-
78
-
79
-
80
-
81
-
82
-
83
-
84
-
85
-
86
-
87
-
88
-
89
-
90
-
91
-
92
-
93
-
94
-
95
-
96
-
97
-
98
-
99
-
100
-
101
-
102
-
103
-
104
-
105
-
106
-
107
-
108
-
109
-
110
-
111
-
112
-
113
-
114
-
115
-
116
-
117
-
118
-
119
-
120
-
121
-
122
-
123
-
124
-
125
-
126
-
127
-
128
-
129
-
130
-
131
-
132
-
133
-
134
-
135
-
136
-
137
-
138
-
139
-
140
-
141
-
142
-
143
-
144
-
145
-
 146
146 -
 147
147 -
 148
148 -
 149
149 -
 150
150 -
 151
151 -
 152
152 -
 153
153 -
 154
154 -
 155
155 -
 156
156 -
 157
157 -
 158
158 -
 159
159 -
 160
160 -
 161
161 -
 162
162 -
 163
163 -
 164
164 -
 165
165 -
 166
166 -
167
-
168
-
169
-
170
-
171
-
172
-
173
-
174
-
175
-
176
-
177
-
178
-
179
-
180
-
181
-
182
-
183
-
184
-
185
-
186
-
187
-
188
-
189
-
190
-
191
-
192
-
193
-
194
-
195
-
196
-
197
-
198
-
199
-
200
-
201
-
202
-
203
-
204
-
205
-
206
-
207
-
208
-
209
-
210
-
211
-
212
-
213
-
214
-
215
-
216
-
217
-
218
-
219
-
220
-
221
-
222
-
223
-
224
-
225
-
226
-
227
-
228
-
229
-
230
-
231
-
232
-
233
-
234
-
235
-
236
-
237
-
238
-
239
-
240
-
241
-
242
-
243
-
244
-
245
-
246
-
247
-
248
-
249
-
250
-
251
-
252
-
253
-
254
-
255
-
256
-
257
-
258
-
259
 |
 |

138
PART II
DUKE ENERGY CORPORATION • DUKE ENERGY CAROLINAS, LLC • PROGRESS ENERGY, INC. •
DUKE ENERGY PROGRESS, INC. • DUKE ENERGY FLORIDA, INC. • DUKE ENERGY OHIO, INC. • DUKE ENERGY INDIANA, INC.
Combined Notes to Consolidated Financial Statements – (Continued)
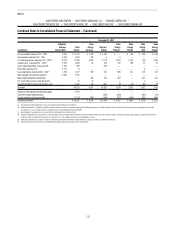
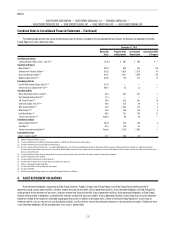
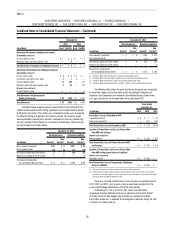
The following table presents changes in the liability associated with asset retirement obligations.
(in millions)
Duke
Energy
Duke
Energy
Carolinas
Progress
Energy
Duke
Energy
Progress
Duke
Energy
Florida
Duke
Energy
Ohio
Duke
Energy
Indiana
Balance at December 31, 2011 $1,936 $1,846 $1,265 $896 $369 $27 $43
Acquisitions(a) 3,062 — — — — — —
Accretion expense(b) 173 118 86 64 22 1 1
Liabilities settled (15) (3) (2) (2) — — (10)
Revisions in estimates of cash ows(c) (4) (2) 234 —234 —(1)
Liabilities incurred in the current year(d) 24 —837 698 139 —4
Balance at December 31, 2012(e) 5,176 1,959 2,420 1,656 764 28 37
Acquisitions 4 — — — — — —
Accretion expense(b) 239 122 113 80 33 2 —
Liabilities settled (12) — (12) — (12) — —
Revisions in estimates of cash ows(f) (449) (487) 49 1 48 (2) (7)
Balance at December 31, 2013(e) $4,958 $1,594 $2,570 $1,737 $833 $ 28 $ 30
(a) Represents asset retirement obligations resulting from the merger with Progress Energy. See Note 2 for additional information.
(b) Substantially all accretion expense for the years ended December 31, 2013 and 2012 relates to Duke Energy’s regulated electric operations and has been deferred in accordance with regulatory accounting treatment.
(c) For Progress Energy and Duke Energy Florida, the amounts relate to the retirement of Crystal River Unit 3.
(d) For Progress Energy, Duke Energy Progress and Duke Energy Florida, amounts primarily relate to spent nuclear fuel disposal recorded in the third quarter of 2012 to conform to Duke Energy’s assumptions for nuclear asset
retirement obligations.
(e) Balances at December 31, 2013 and 2012, include $8 million and $7 million, respectively, reported in Other current liabilities on the Consolidated Balance Sheets at Duke Energy, Progress Energy and Duke Energy Progress.
(f) Amounts for Duke Energy, Duke Energy Carolinas and Duke Energy Florida primarily relate to the site-specic nuclear decommissioning cost studies completed in 2013.
The Duke Energy Registrants’ regulated operations accrue costs of
removal for property that does not have an associated legal retirement
obligation based on regulatory orders from state commissions. These costs
of removal are recorded as a regulatory liability in accordance with regulatory
accounting treatment. The Duke Energy Registrants do not accrue the estimated
cost of removal for any nonregulated assets. See Note 4 for the estimated cost
of removal for assets without an associated legal retirement obligation, which
are included in Regulatory liabilities on the Consolidated Balance Sheets.
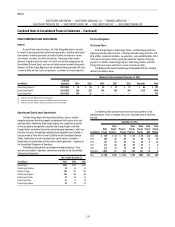
NUCLEAR DECOMMISSIONING COSTS
Use of the NDTF investments is restricted to nuclear decommissioning
activities. The NDTF investments are managed and invested in accordance with
applicable requirements of various regulatory bodies, including the NRC, FERC,
NCUC, PSCSC, FPSC and the Internal Revenue Service (IRS). The fair value of
assets legally restricted for purposes of settling asset retirement obligations
associated with nuclear decommissioning are $4,769 million and $2,477 million
for Duke Energy and Duke Energy Carolinas at December 31, 2013, respectively,
and $3,941 million and $2,053 million for Duke Energy and Duke Energy
Carolinas at December 31, 2012, respectively. The NDTF balances for Progress
Energy, Duke Energy Progress and Duke Energy Florida represent the fair value
of assets legally restricted for purposes of settling asset retirement obligations
associated with nuclear decommissioning. The NCUC, PSCSC and FPSC require
updated cost estimates for decommissioning nuclear plants every ve years.
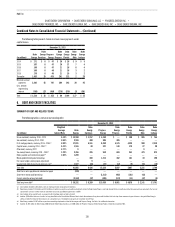
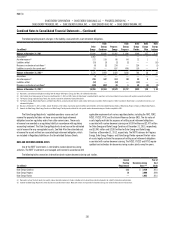
The following table summarizes information about nuclear decommissioning cost studies.
(in millions)
Annual
Funding
Requirement
Decommissioning
Costs(a)(b)
Year of
Cost
Study
Duke Energy Carolinas $ 21 $ 3,420 2013
Duke Energy Progress 14 3,000 2009
Duke Energy Florida — 1,083 2013
(a) Represents cost per the most recent site-specic nuclear decommissioning cost studies, including costs to decommission plant components not subject to radioactive contamination.
(b) Includes the Duke Energy Registrants’ ownership interest in jointly owned reactors. Other joint owners are responsible for decommissioning costs related to their interest in the reactors.