Duke Energy 2013 Annual Report Download - page 65
Download and view the complete annual report
Please find page 65 of the 2013 Duke Energy annual report below. You can navigate through the pages in the report by either clicking on the pages listed below, or by using the keyword search tool below to find specific information within the annual report.-
 1
1 -
2
-
3
-
4
-
5
-
6
-
7
-
8
-
9
-
10
-
11
-
12
-
13
-
14
-
15
-
16
-
17
-
18
-
19
-
20
-
21
-
22
-
23
-
24
-
25
-
26
-
27
-
28
-
29
-
30
-
31
-
32
-
33
-
34
-
35
-
36
-
37
-
38
-
39
-
40
-
41
-
42
-
43
-
44
-
45
-
46
-
47
-
48
-
49
-
50
-
51
-
52
-
53
-
54
-
 55
55 -
 56
56 -
 57
57 -
 58
58 -
 59
59 -
 60
60 -
 61
61 -
 62
62 -
 63
63 -
 64
64 -
 65
65 -
 66
66 -
 67
67 -
 68
68 -
 69
69 -
 70
70 -
 71
71 -
 72
72 -
 73
73 -
 74
74 -
 75
75 -
76
-
77
-
78
-
79
-
80
-
81
-
82
-
83
-
84
-
85
-
86
-
87
-
88
-
89
-
90
-
91
-
92
-
93
-
94
-
95
-
96
-
97
-
98
-
99
-
100
-
101
-
102
-
103
-
104
-
105
-
106
-
107
-
108
-
109
-
110
-
111
-
112
-
113
-
114
-
115
-
116
-
117
-
118
-
119
-
120
-
121
-
122
-
123
-
124
-
125
-
126
-
127
-
128
-
129
-
130
-
131
-
132
-
133
-
134
-
135
-
136
-
137
-
138
-
139
-
140
-
141
-
142
-
143
-
144
-
145
-
146
-
147
-
148
-
149
-
150
-
151
-
152
-
153
-
154
-
155
-
156
-
157
-
158
-
159
-
160
-
161
-
162
-
163
-
164
-
165
-
166
-
167
-
168
-
169
-
170
-
171
-
172
-
173
-
174
-
175
-
176
-
177
-
178
-
179
-
180
-
181
-
182
-
183
-
184
-
185
-
186
-
187
-
188
-
189
-
190
-
191
-
192
-
193
-
194
-
195
-
196
-
197
-
198
-
199
-
200
-
201
-
202
-
203
-
204
-
205
-
206
-
207
-
208
-
209
-
210
-
211
-
212
-
213
-
214
-
215
-
216
-
217
-
218
-
219
-
220
-
221
-
222
-
223
-
224
-
225
-
226
-
227
-
228
-
229
-
230
-
231
-
232
-
233
-
234
-
235
-
236
-
237
-
238
-
239
-
240
-
241
-
242
-
243
-
244
-
245
-
246
-
247
-
248
-
249
-
250
-
251
-
252
-
253
-
254
-
255
-
256
-
257
-
258
-
259
 |
 |

47
PART II
to classify the Midwest generation business as held for sale and record an
estimated pretax impairment charge of $1 billion to $2 billion in the first
quarter of 2014. As discussed further in Note 2 to the Consolidated Financial
Statements, “Acquisitions, Dispositions, and Sales of Other Assets,” in the third
quarter of 2012, Duke Energy Carolinas and Duke Energy Progress recorded
certain impairment charges in conjunction with the merger between Duke
Energy and Progress Energy. As discussed further in Note 11 to the Consolidated
Financial Statements, “Goodwill and Intangible Assets,” in the third quarter of
2011, Commercial Power recorded $79 million of pretax impairment charges
related to CAA emission allowances that were no longer expected to be used
as a result of the issuance of the final CSAPR. These impairment charges
are recorded in Goodwill and Other Impairment Charges on Duke Energy’s
Consolidated Statement of Operations.
Accounting for Loss Contingencies
Preparation of financial statements and related disclosures require
judgments regarding the future outcome of contingent events. Duke Energy is
involved in certain legal and environmental matters arising in the normal course
of business. Estimating probable losses requires analysis of multiple forecasts
and scenarios that often depend on judgments about potential actions by third
parties, such as federal, state and local courts and other regulators. Contingent
liabilities are often resolved over long periods of time. Amounts recorded in the
consolidated financial statements may differ from the actual outcome once the
contingency is resolved, which could have a material impact on future results of
operations, financial position and cash flows of Duke Energy.
For further information, see Note 5 to the Consolidated Financial
Statements, “Commitments and Contingencies.”
Pension and Other Post-Retirement Benefits
The calculation of pension expense, other post-retirement benefit expense
and net pension and other post-retirement assets or liabilities require the use
of assumptions and election of permissible accounting alternatives. Changes in
assumptions can result in different expense and reported asset or liability amounts,
and future actual experience can differ from the assumptions. Duke Energy believes
the most critical assumptions for pension and other post-retirement benefits are
the expected long-term rate of return on plan assets and the assumed discount
rate. Additionally, medical and prescription drug cost trend rate assumptions are
critical to Duke Energy’s estimates of other post-retirement benefits.
Duke Energy elects to amortize net actuarial gains or losses in excess
of the corridor of 10 percent of the greater of the market-related value of plan
assets or plan projected benefit obligation, into net pension or other post-
retirement benefit expense over the average remaining service period of active
covered employees. Prior service cost or credit, which represents the effect on
plan liabilities due to plan amendments, is amortized over the average remaining
service period of active covered employees.
Duke Energy maintains non-contributory defined benefit retirement
plans. The plans cover most U.S. employees using a cash balance formula.
Under a cash balance formula, a plan participant accumulates a retirement
benefit consisting of pay credits based upon a percentage of current eligible
earnings based on age and years of service and current interest credits. Certain
employees are covered under plans that use a final average earnings formula.
Duke Energy provides some health care and life insurance benefits
for retired employees on a contributory and non-contributory basis. Certain
employees are eligible for these benefits if they have met age and service
requirements at retirement, as defined in the plans.
For both pension and other post-retirement plans, Duke Energy assumes
its plan’s assets will generate a long-term rate of return of 6.75 percent as
of December 31, 2013. The expected long-term rate of return was developed
using a weighted average calculation of expected returns based primarily on
future expected returns across asset classes considering the use of active asset
managers, where applicable. U.S. equities are held for their high expected return.
Non-U.S. equities, debt securities, hedge funds, real estate and other global
securities are held for diversification. Investments within asset classes are to
be diversified to achieve broad market participation and reduce the impact of
individual managers on investments. In September 2013, Duke Energy adopted a
de-risking investment strategy for its pension plan assets. As the funded status
of the Duke Energy and Progress Energy pension plans increase, over time the
allocation to return-seeking assets will be reduced and the allocation to fixed-
income assets will be increased to better manage Duke Energy’s pension liability
and reduce funded status volatility. Based on the current funded status of the
plans, the asset allocation for the Duke Energy pension plans has been adjusted
to 60 percent fixed-income assets and 40 percent return-seeking assets and the
asset allocation for the Progress Energy pension plans has been adjusted to
55 percent fixed-income assets and 45 percent return-seeking assets.
The assets for Duke Energy’s pension and other post-retirement plans are
maintained in a master trust. Duke Energy also invests other post-retirement
assets in the Duke Energy Corporation Employee Benefits Trust (VEBA I). The
investment objective of VEBA I is to achieve sufficient returns, subject to a
prudent level of portfolio risk, for the purpose of promoting the security of plan
benefits for participants. VEBA I is passively managed.
Duke Energy discounted its future U.S. pension and other post-retirement
obligations using a rate of 4.7 percent as of December 31, 2013. Discount rates
used to measure benefit plan obligations for financial reporting purposes reflect
rates at which pension benefits could be effectively settled. As of December 31,
2013, Duke Energy determined its discount rate for U.S. pension and other
post-retirement obligations using a bond selection-settlement portfolio
approach. This approach develops a discount rate by selecting a portfolio of high
quality corporate bonds that generate sufficient cash flow to match the timing
of projected benefit payments. The selected bond portfolio is derived from a
universe of non-callable corporate bonds rated Aa quality or higher. After the
bond portfolio is selected, a single interest rate is determined that equates the
present value of the plan’s projected benefit payments discounted at this rate
with the market value of the bonds selected.
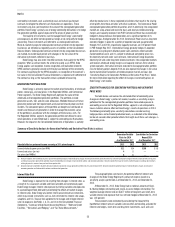
Future changes in plan asset returns, assumed discount rates and
various other factors related to the participants in Duke Energy’s pension and
post-retirement plans will impact future pension expense and liabilities. Duke
Energy cannot predict with certainty what these factors will be in the future. The
following table presents the approximate effect on Duke Energy’s 2013 pretax
pension expense, pension obligation and other post-retirement benefit obligation
if a 0.25 percent change in rates were to occur.
Qualified and Non-
Qualified Pension Plans Other Post-retirement Plans
(in millions) +0.25% -0.25% +0.25% -0.25%
Effect on 2013 pretax pension expense
Expected long-term rate of return $ (18)$ 18 $ (1) $ 1
Discount rate (16) 16 (4) 4
Effect on benefit obligation at December 31, 2013
Discount rate $ (194)$ 200 $ (23)$ 24