Duke Energy 2013 Annual Report Download - page 73
Download and view the complete annual report
Please find page 73 of the 2013 Duke Energy annual report below. You can navigate through the pages in the report by either clicking on the pages listed below, or by using the keyword search tool below to find specific information within the annual report.-
 1
1 -
2
-
3
-
4
-
5
-
6
-
7
-
8
-
9
-
10
-
11
-
12
-
13
-
14
-
15
-
16
-
17
-
18
-
19
-
20
-
21
-
22
-
23
-
24
-
25
-
26
-
27
-
28
-
29
-
30
-
31
-
32
-
33
-
34
-
35
-
36
-
37
-
38
-
39
-
40
-
41
-
42
-
43
-
44
-
45
-
46
-
47
-
48
-
49
-
50
-
51
-
52
-
53
-
54
-
55
-
56
-
57
-
58
-
59
-
60
-
61
-
62
-
 63
63 -
 64
64 -
 65
65 -
 66
66 -
 67
67 -
 68
68 -
 69
69 -
 70
70 -
 71
71 -
 72
72 -
 73
73 -
 74
74 -
 75
75 -
 76
76 -
 77
77 -
 78
78 -
 79
79 -
 80
80 -
 81
81 -
 82
82 -
 83
83 -
84
-
85
-
86
-
87
-
88
-
89
-
90
-
91
-
92
-
93
-
94
-
95
-
96
-
97
-
98
-
99
-
100
-
101
-
102
-
103
-
104
-
105
-
106
-
107
-
108
-
109
-
110
-
111
-
112
-
113
-
114
-
115
-
116
-
117
-
118
-
119
-
120
-
121
-
122
-
123
-
124
-
125
-
126
-
127
-
128
-
129
-
130
-
131
-
132
-
133
-
134
-
135
-
136
-
137
-
138
-
139
-
140
-
141
-
142
-
143
-
144
-
145
-
146
-
147
-
148
-
149
-
150
-
151
-
152
-
153
-
154
-
155
-
156
-
157
-
158
-
159
-
160
-
161
-
162
-
163
-
164
-
165
-
166
-
167
-
168
-
169
-
170
-
171
-
172
-
173
-
174
-
175
-
176
-
177
-
178
-
179
-
180
-
181
-
182
-
183
-
184
-
185
-
186
-
187
-
188
-
189
-
190
-
191
-
192
-
193
-
194
-
195
-
196
-
197
-
198
-
199
-
200
-
201
-
202
-
203
-
204
-
205
-
206
-
207
-
208
-
209
-
210
-
211
-
212
-
213
-
214
-
215
-
216
-
217
-
218
-
219
-
220
-
221
-
222
-
223
-
224
-
225
-
226
-
227
-
228
-
229
-
230
-
231
-
232
-
233
-
234
-
235
-
236
-
237
-
238
-
239
-
240
-
241
-
242
-
243
-
244
-
245
-
246
-
247
-
248
-
249
-
250
-
251
-
252
-
253
-
254
-
255
-
256
-
257
-
258
-
259
 |
 |

55
PART II
commodity instruments such as electricity, coal and natural gas forward
contracts to mitigate the effect of such fluctuations on operations. These
instruments are also used to optimize the value of the nonregulated generation
portfolio. Duke Energy’s primary use of energy commodity derivatives is to hedge
the generation portfolio against exposure to the prices of power and fuel.
The majority of instruments used to manage Duke Energy’s commodity
price exposure are either not designated as hedges or do not qualify for hedge
accounting. These instruments are referred to as undesignated contracts.
Mark-to-market changes for undesignated contracts entered into by regulated
businesses are reflected as regulatory assets or liabilities on the Consolidated
Balance Sheets. Undesignated contracts entered into by unregulated businesses
are marked-to-market each period, with changes in the fair value of the
derivative instruments reflected in earnings.
Duke Energy may also enter into other contracts that qualify for the NPNS
exception. When a contract meets the criteria to qualify as an NPNS, Duke
Energy applies such exception. Income recognition and realization related to
NPNS contracts generally coincide with the physical delivery of the commodity.
For contracts qualifying for the NPNS exception, no recognition of the contract’s
fair value in the Consolidated Financial Statements is required until settlement of
the contract as long as the transaction remains probable of occurring.
GENERATION PORTFOLIO RISKS
Duke Energy is primarily exposed to market price fluctuations of wholesale
power, natural gas, and coal prices in the Regulated Utilities and Commercial
Power segments. The Duke Energy Registrants optimize the value of their
wholesale and nonregulated generation portfolios. The portfolios include
generation assets, fuel, and emission allowances. Modeled forecasts of future
generation output and fuel requirements are based on forward power and fuel
markets. The component pieces of the portfolio are bought and sold based on
models and forecasts of generation in order to manage the economic value
of the portfolio in accordance with the strategies of the business units. For
the Regulated Utilities segment, the generation portfolio not utilized to serve
retail operations or committed load is subject to commodity price fluctuations.
However, the impact on the Consolidated Statements of Operations is partially
offset by mechanisms in these regulated jurisdictions that result in the sharing
of net profits from these activities with retail customers. The Commercial Power
nonregulated generation portfolio dispatches all of its electricity into unregulated
markets on a day-ahead and real-time basis and receives wholesale energy
margins and capacity revenues from PJM. Commercial Power has economically
hedged its forecasted coal-fired generation and a significant portion of its
forecasted gas-fired generation for 2014. Commercial Power also has long-term
economic hedges in place for a portion of expected coal and gas generation
through 2017 and 2018, respectively. Capacity revenues are 100 percent fixed
in PJM through May 2017. International Energy generally hedges its expected
generation using long-term bilateral power sales contracts when favorable
market conditions exist and it is subject to wholesale commodity price risks
for electricity not sold under such contracts. International Energy dispatches
electricity not sold under long-term bilateral contracts into unregulated markets
and receives wholesale energy margins and capacity revenues from national
system operators. Derivative contracts executed to manage generation portfolio
risks for delivery periods beyond 2014 are also exposed to changes in fair value
due to market price fluctuations of wholesale power, fuel oil and coal. See
“Sensitivity Analysis for Generation Portfolio and Derivative Price Risks” below,
for more information regarding the effect of changes in commodity prices on
Duke Energy’s net income.
SENSITIVITY ANALYSIS FOR GENERATION PORTFOLIO AND DERIVATIVE
PRICE RISKS
The table below summarizes the estimated effect of commodity price
changes on Duke Energy’s pretax net income, based on a sensitivity analysis
performed for the nonregulated generation portfolio. Forecasted exposure to
commodity price risk for the Regulated Utilities segment is not anticipated to
have a material adverse effect on Duke Energy’s results of operations in 2014.
The following commodity price sensitivity calculations consider existing
hedge positions and estimated production levels, as indicated in the table below,
but do not consider other potential effects that might result from such changes in
commodity prices.
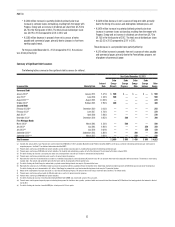
Summary of Sensitivity Analysis for Generation Portfolio and Derivative Price Risks (in millions)
Generation Portfolio
Risks for 2014
As of December 31,(a)
Sensitivities for Derivatives
Beyond 2014
As of December 31,(b)
Potential effect on pretax net income assuming a 10% price change in 2013 2012 2013 2012
Forward wholesale power prices (per MWh) $11 $34 $158 $ 103
Forward coal prices (per ton) 411 ——
Gas prices (per MMBtu) 621 ——
(a) Amounts related to forward wholesale prices represent the potential impact of commodity price changes on forecasted economic generation which has not been contracted or hedged. Amounts related to forward coal prices
and forward gas prices represent the potential impact of commodity price changes on fuel needed to achieve such economic generation. Amounts exclude the impact of mark-to-market changes on undesignated contracts
relating to periods in excess of one year from the respective date.
(b) Amounts represent sensitivities related to derivative contracts executed to manage generation portfolio risks for periods beyond 2013. Amounts exclude the potential impact of commodity price changes on forecasted
economic generation and fuel needed to achieve such forecasted generation.
Interest Rate Risk
Duke Energy is exposed to risk resulting from changes in interest rates as
a result of its issuance of variable and fixed-rate debt and commercial paper.
Duke Energy manages interest rate exposure by limiting variable-rate exposures
to a percentage of total debt and by monitoring the effects of market changes
in interest rates. Duke Energy also enters into financial derivative instruments,
which may include instruments such as, but not limited to, interest rate swaps,
swaptions and U.S. Treasury lock agreements to manage and mitigate interest
rate risk exposure. See Notes 1, 6, 14, and 16 to the Consolidated Financial
Statements, “Summary of Significant Accounting Policies,” “Debt and Credit
Facilities,” “Derivatives and Hedging,” and “Fair Value Measurements.”
The paragraph below summarizes the potential effect of interest rate
changes on the Duke Energy Registrants’ pretax net income, based on a
sensitivity analysis performed as of December 31, 2013 and December 31,
2012.
At December 31, 2013, Duke Energy had no notional amounts of fixed-
to-floating hedges outstanding and no pre-issuance hedges outstanding. The
weighted average interest rate on $5,677 million of long-term and short-term
variable interest rate exposure that has not been hedged at December 31, 2013
was 1.45 percent.
These amounts were estimated by considering the impact of the
hypothetical interest rates on variable-rate securities outstanding, adjusted for
interest rate hedges, short-term and long-term investments, cash and cash