Duke Energy 2013 Annual Report Download - page 215
Download and view the complete annual report
Please find page 215 of the 2013 Duke Energy annual report below. You can navigate through the pages in the report by either clicking on the pages listed below, or by using the keyword search tool below to find specific information within the annual report.-
 1
1 -
2
-
3
-
4
-
5
-
6
-
7
-
8
-
9
-
10
-
11
-
12
-
13
-
14
-
15
-
16
-
17
-
18
-
19
-
20
-
21
-
22
-
23
-
24
-
25
-
26
-
27
-
28
-
29
-
30
-
31
-
32
-
33
-
34
-
35
-
36
-
37
-
38
-
39
-
40
-
41
-
42
-
43
-
44
-
45
-
46
-
47
-
48
-
49
-
50
-
51
-
52
-
53
-
54
-
55
-
56
-
57
-
58
-
59
-
60
-
61
-
62
-
63
-
64
-
65
-
66
-
67
-
68
-
69
-
70
-
71
-
72
-
73
-
74
-
75
-
76
-
77
-
78
-
79
-
80
-
81
-
82
-
83
-
84
-
85
-
86
-
87
-
88
-
89
-
90
-
91
-
92
-
93
-
94
-
95
-
96
-
97
-
98
-
99
-
100
-
101
-
102
-
103
-
104
-
105
-
106
-
107
-
108
-
109
-
110
-
111
-
112
-
113
-
114
-
115
-
116
-
117
-
118
-
119
-
120
-
121
-
122
-
123
-
124
-
125
-
126
-
127
-
128
-
129
-
130
-
131
-
132
-
133
-
134
-
135
-
136
-
137
-
138
-
139
-
140
-
141
-
142
-
143
-
144
-
145
-
146
-
147
-
148
-
149
-
150
-
151
-
152
-
153
-
154
-
155
-
156
-
157
-
158
-
159
-
160
-
161
-
162
-
163
-
164
-
165
-
166
-
167
-
168
-
169
-
170
-
171
-
172
-
173
-
174
-
175
-
176
-
177
-
178
-
179
-
180
-
181
-
182
-
183
-
184
-
185
-
186
-
187
-
188
-
189
-
190
-
191
-
192
-
193
-
194
-
195
-
196
-
197
-
198
-
199
-
200
-
201
-
202
-
203
-
204
-
 205
205 -
 206
206 -
 207
207 -
 208
208 -
 209
209 -
 210
210 -
 211
211 -
 212
212 -
 213
213 -
 214
214 -
 215
215 -
 216
216 -
 217
217 -
 218
218 -
 219
219 -
 220
220 -
 221
221 -
 222
222 -
 223
223 -
 224
224 -
 225
225 -
226
-
227
-
228
-
229
-
230
-
231
-
232
-
233
-
234
-
235
-
236
-
237
-
238
-
239
-
240
-
241
-
242
-
243
-
244
-
245
-
246
-
247
-
248
-
249
-
250
-
251
-
252
-
253
-
254
-
255
-
256
-
257
-
258
-
259
 |
 |

197
PART II
DUKE ENERGY CORPORATION • DUKE ENERGY CAROLINAS, LLC • PROGRESS ENERGY, INC. •
DUKE ENERGY PROGRESS, INC. • DUKE ENERGY FLORIDA, INC. • DUKE ENERGY OHIO, INC. • DUKE ENERGY INDIANA, INC.
Combined Notes to Consolidated Financial Statements – (Continued)
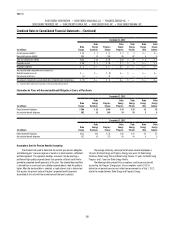
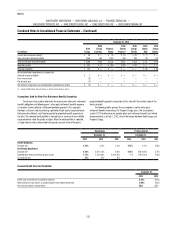
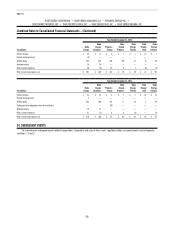
The following table provides a reconciliation of beginning and ending balances of assets of master trusts measured at fair value on a recurring basis where the
determination of fair value includes significant unobservable inputs (Level 3).
(in millions) 2013 2012
Balance at January 1 $ 352 $322
Combination of trust assets 288 —
Purchases, sales, issuances and settlements
Purchases 25 21
Sales (152) (4)
Total gains (losses) and other 33 13
Balance at December 31 $ 546 $352
Progress Energy Master Retirement Trust
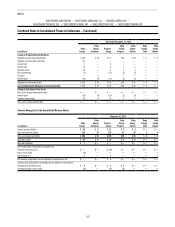
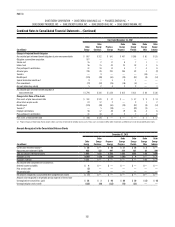
The following table provides the fair value measurement amounts for the Progress Energy Master Retirement Trust qualified pension assets.
December 31, 2012
(in millions) Total Fair Value Level 1 Level 2 Level 3
Equity securities $ 1,094 $ 361 $ 733 $ —
Corporate debt securities 432 — 432 —
Partnership interests 154 — — 154
Hedge funds 313 — 189 124
U.S. government securities 515 405 110 —
Governments bonds – foreign 6 — 6 —
Cash 160 113 47 —
Net pending transactions and other investments 16 — 6 10
Total assets(a) $ 2,690 $ 879 $1,523 $ 288
(a) Duke Energy Progress and Duke Energy Florida were allocated approximately 48 percent and 44 percent, respectively, of the Progress Energy Master Trust assets at December 31, 2012. Accordingly, all Level 1, 2 and 3
amounts included in the table above are allocable to Duke Energy Progress and Duke Energy Florida using these percentages.
The following table provides a reconciliation of beginning and ending balances of Progress Trust assets measured at fair value on a recurring basis where the
determination of fair value includes significant unobservable inputs (Level 3).
(in millions) 2013 2012
Balance at January 1 $ 288 $ 311
Combination of trust assets (288) —
Purchases, sales, issuances and settlements
Purchases —13
Sales —(14)
Transfers in and/or out of level 3 —(41)
Total gains (losses) and other —19
Balance at December 31 $ — $ 288