Duke Energy 2013 Annual Report Download - page 120
Download and view the complete annual report
Please find page 120 of the 2013 Duke Energy annual report below. You can navigate through the pages in the report by either clicking on the pages listed below, or by using the keyword search tool below to find specific information within the annual report.-
 1
1 -
2
-
3
-
4
-
5
-
6
-
7
-
8
-
9
-
10
-
11
-
12
-
13
-
14
-
15
-
16
-
17
-
18
-
19
-
20
-
21
-
22
-
23
-
24
-
25
-
26
-
27
-
28
-
29
-
30
-
31
-
32
-
33
-
34
-
35
-
36
-
37
-
38
-
39
-
40
-
41
-
42
-
43
-
44
-
45
-
46
-
47
-
48
-
49
-
50
-
51
-
52
-
53
-
54
-
55
-
56
-
57
-
58
-
59
-
60
-
61
-
62
-
63
-
64
-
65
-
66
-
67
-
68
-
69
-
70
-
71
-
72
-
73
-
74
-
75
-
76
-
77
-
78
-
79
-
80
-
81
-
82
-
83
-
84
-
85
-
86
-
87
-
88
-
89
-
90
-
91
-
92
-
93
-
94
-
95
-
96
-
97
-
98
-
99
-
100
-
101
-
102
-
103
-
104
-
105
-
106
-
107
-
108
-
109
-
 110
110 -
 111
111 -
 112
112 -
 113
113 -
 114
114 -
 115
115 -
 116
116 -
 117
117 -
 118
118 -
 119
119 -
 120
120 -
 121
121 -
 122
122 -
 123
123 -
 124
124 -
 125
125 -
 126
126 -
 127
127 -
 128
128 -
 129
129 -
 130
130 -
131
-
132
-
133
-
134
-
135
-
136
-
137
-
138
-
139
-
140
-
141
-
142
-
143
-
144
-
145
-
146
-
147
-
148
-
149
-
150
-
151
-
152
-
153
-
154
-
155
-
156
-
157
-
158
-
159
-
160
-
161
-
162
-
163
-
164
-
165
-
166
-
167
-
168
-
169
-
170
-
171
-
172
-
173
-
174
-
175
-
176
-
177
-
178
-
179
-
180
-
181
-
182
-
183
-
184
-
185
-
186
-
187
-
188
-
189
-
190
-
191
-
192
-
193
-
194
-
195
-
196
-
197
-
198
-
199
-
200
-
201
-
202
-
203
-
204
-
205
-
206
-
207
-
208
-
209
-
210
-
211
-
212
-
213
-
214
-
215
-
216
-
217
-
218
-
219
-
220
-
221
-
222
-
223
-
224
-
225
-
226
-
227
-
228
-
229
-
230
-
231
-
232
-
233
-
234
-
235
-
236
-
237
-
238
-
239
-
240
-
241
-
242
-
243
-
244
-
245
-
246
-
247
-
248
-
249
-
250
-
251
-
252
-
253
-
254
-
255
-
256
-
257
-
258
-
259
 |
 |

102
PART II
DUKE ENERGY CORPORATION • DUKE ENERGY CAROLINAS, LLC • PROGRESS ENERGY, INC. •
DUKE ENERGY PROGRESS, INC. • DUKE ENERGY FLORIDA, INC. • DUKE ENERGY OHIO, INC. • DUKE ENERGY INDIANA, INC.
Combined Notes to Consolidated Financial Statements – (Continued)
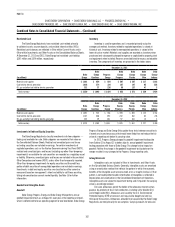
Restricted Cash
The Duke Energy Registrants have restricted cash related primarily
to collateral assets, escrow deposits, and variable interest entities (VIEs).
Restricted cash balances are reected in Other within Current Assets and in
Other within Investments and Other Assets on the Consolidated Balance Sheets.
At December 31, 2013 and 2012, Duke Energy had restricted cash totaling
$307 million and $574 million, respectively.
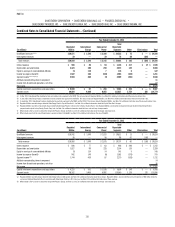
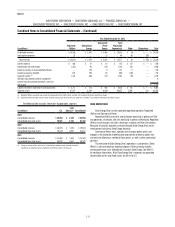
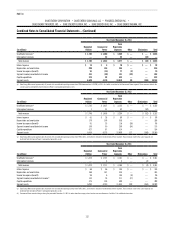
Inventory
Inventory is used for operations and is recorded primarily using the
average cost method. Inventory related to regulated operations is valued at
historical cost. Inventory related to nonregulated operations is valued at the
lower of cost or market. Materials and supplies are recorded as inventory when
purchased and subsequently charged to expense or capitalized to property, plant
and equipment when installed. Reserves are established for excess and obsolete
inventory. The components of inventory are presented in the tables below.
December 31, 2013
(in millions)
Duke
Energy
Duke
Energy
Carolinas
Progress
Energy
Duke
Energy
Progress
Duke
Energy
Florida
Duke
Energy
Ohio
Duke
Energy
Indiana
Materials and supplies $ 1,901 $ 654 $ 854 $ 567 $ 287 $ 117 $ 193
Coal held for electric generation 1,018 374 334 187 147 65 238
Oil, gas and other fuel held for electric generation 331 37 236 99 137 47 3
Total inventory $ 3,250 $ 1,065 $ 1,424 $ 853 $ 571 $ 229 $ 434
December 31, 2012
(in millions)
Duke
Energy
Duke
Energy
Carolinas
Progress
Energy
Duke
Energy
Progress
Duke
Energy
Florida
Duke
Energy
Ohio
Duke
Energy
Indiana
Materials and supplies $ 1,691 $ 535 $ 768 $ 499 $ 269 $ 135 $ 161
Coal held for electric generation 1,187 488 392 232 160 82 216
Oil, gas and other fuel held for electric generation 345 39 281 97 184 10 3
Total inventory $ 3,223 $ 1,062 $ 1,441 $ 828 $ 613 $ 227 $ 380
Investments in Debt and Equity Securities
The Duke Energy Registrants classify investments into two categories —
trading and available-for-sale. Both categories are recorded at fair value on
the Consolidated Balance Sheets. Realized and unrealized gains and losses
on trading securities are included in earnings. For certain investments of
regulated operations such as the Nuclear Decommissioning Trust Fund (NDTF),
realized and unrealized gains and losses (including any other-than-temporary
impairments) on available-for-sale securities are recorded as a regulatory asset
or liability. Otherwise, unrealized gains and losses are included in Accumulated
Other Comprehensive Income (AOCI), unless other-than-temporarily impaired.
Other-than-temporary impairments for equity securities and the credit loss
portion of debt securities of nonregulated operations are included in earnings.
Investments in debt and equity securities are classied as either current or
noncurrent based on management’s intent and ability to sell these securities,
taking into consideration current market liquidity. See Note 15 for further
information.
Goodwill and Intangible Assets
Goodwill
Duke Energy, Progress Energy and Duke Energy Ohio perform annual
goodwill impairment tests as of August 31 each year at the reporting unit level,
which is determined to be an operating segment or one level below. Duke Energy,
Progress Energy and Duke Energy Ohio update these tests between annual tests
if events or circumstances occur that would more likely than not reduce the fair
value of a reporting unit below its carrying value.
In 2012, Progress Energy changed its goodwill impairment testing date
from October 31 to August 31 to better align its annual goodwill impairment
testing procedure with those of Duke Energy. The change had no impact on
goodwill. Neither the change in the goodwill impairment testing date nor the
merger resulted in any changes to the Progress Energy reporting units.
Intangible Assets
Intangible assets are included in Other in Investments and Other Assets
on the Consolidated Balance Sheets. Generally, intangible assets are amortized
using an amortization method that reects the pattern in which the economic
benets of the intangible asset are consumed, or on a straight-line basis if that
pattern is not readily determinable. Amortization of intangibles is reected in
Depreciation and amortization in the Consolidated Statements of Operations.
Intangible assets are subject to impairment testing and if impaired, the carrying
value is accordingly reduced.
Emission allowances permit the holder of the allowance to emit certain
gaseous by-products of fossil fuel combustion, including sulfur dioxide (SO2)
and nitrogen oxide (NOx). Allowances are issued by the U.S. Environmental
Protection Agency (EPA) at zero cost and may also be bought and sold via
third-party transactions. Allowances allocated to or acquired by the Duke Energy
Registrants are held primarily for consumption. Carrying amounts for emission