Duke Energy 2013 Annual Report Download - page 59
Download and view the complete annual report
Please find page 59 of the 2013 Duke Energy annual report below. You can navigate through the pages in the report by either clicking on the pages listed below, or by using the keyword search tool below to find specific information within the annual report.-
 1
1 -
2
-
3
-
4
-
5
-
6
-
7
-
8
-
9
-
10
-
11
-
12
-
13
-
14
-
15
-
16
-
17
-
18
-
19
-
20
-
21
-
22
-
23
-
24
-
25
-
26
-
27
-
28
-
29
-
30
-
31
-
32
-
33
-
34
-
35
-
36
-
37
-
38
-
39
-
40
-
41
-
42
-
43
-
44
-
45
-
46
-
47
-
48
-
 49
49 -
 50
50 -
 51
51 -
 52
52 -
 53
53 -
 54
54 -
 55
55 -
 56
56 -
 57
57 -
 58
58 -
 59
59 -
 60
60 -
 61
61 -
 62
62 -
 63
63 -
 64
64 -
 65
65 -
 66
66 -
 67
67 -
 68
68 -
 69
69 -
70
-
71
-
72
-
73
-
74
-
75
-
76
-
77
-
78
-
79
-
80
-
81
-
82
-
83
-
84
-
85
-
86
-
87
-
88
-
89
-
90
-
91
-
92
-
93
-
94
-
95
-
96
-
97
-
98
-
99
-
100
-
101
-
102
-
103
-
104
-
105
-
106
-
107
-
108
-
109
-
110
-
111
-
112
-
113
-
114
-
115
-
116
-
117
-
118
-
119
-
120
-
121
-
122
-
123
-
124
-
125
-
126
-
127
-
128
-
129
-
130
-
131
-
132
-
133
-
134
-
135
-
136
-
137
-
138
-
139
-
140
-
141
-
142
-
143
-
144
-
145
-
146
-
147
-
148
-
149
-
150
-
151
-
152
-
153
-
154
-
155
-
156
-
157
-
158
-
159
-
160
-
161
-
162
-
163
-
164
-
165
-
166
-
167
-
168
-
169
-
170
-
171
-
172
-
173
-
174
-
175
-
176
-
177
-
178
-
179
-
180
-
181
-
182
-
183
-
184
-
185
-
186
-
187
-
188
-
189
-
190
-
191
-
192
-
193
-
194
-
195
-
196
-
197
-
198
-
199
-
200
-
201
-
202
-
203
-
204
-
205
-
206
-
207
-
208
-
209
-
210
-
211
-
212
-
213
-
214
-
215
-
216
-
217
-
218
-
219
-
220
-
221
-
222
-
223
-
224
-
225
-
226
-
227
-
228
-
229
-
230
-
231
-
232
-
233
-
234
-
235
-
236
-
237
-
238
-
239
-
240
-
241
-
242
-
243
-
244
-
245
-
246
-
247
-
248
-
249
-
250
-
251
-
252
-
253
-
254
-
255
-
256
-
257
-
258
-
259
 |
 |

41
PART II
DUKE ENERGY PROGRESS
Introduction
Management’s Discussion and Analysis should be read in conjunction with
the accompanying Consolidated Financial Statements and Notes for the years
ended December 31, 2013, 2012, and 2011.
Basis of Presentation
The results of operations and variance discussion for Duke Energy
Progress is presented in a reduced disclosure format in accordance with General
Instruction (I)(2)(a) of Form 10-K.
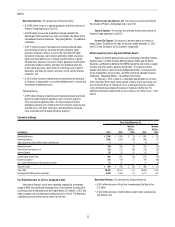
Results of Operations
Years Ended December 31,
(in millions) 2013 2012 Variance
Operating Revenues $4,992 $4,706 $ 286
Operating Expenses 4,061 4,197 (136)
Gains on Sales of Other Asset and Other, net 11 —
Operating Income 932 510 422
Other Income and Expense, net 57 79 (22)
Interest Expense 201 207 (6)
Income Before Income Taxes 788 382 406
Income Tax Expense 288 110 178
Net Income 500 272 228
Preferred Stock Dividend Requirement —3 (3)
Net Income Attributable to Parent $ 500 $ 269 $ 231
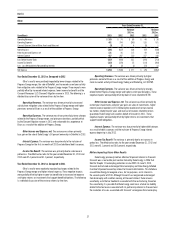
The following table shows the percent changes in GWh sales and average number of customers for Duke Energy Progress. The below percentages for retail
customer classes represent billed sales only. Total sales includes billed and unbilled retail sales, and wholesale sales to incorporated municipalities and to public and
private utilities and power marketers. Amounts are not weather normalized.
Increase (decrease) over prior year 2013 2012
Residential sales 4.0 % (8.2)%
General service sales — % (1.8)%
Industrial sales 1.1 % (1.0)%
Wholesale power sales 7.6 % 25.9 %
Total sales 3.1 % 3.9 %
Average number of customers 0.9 % 0.8 %
Year Ended December 31, 2013 as Compared to 2012
Operating Revenues. The variance was primarily due to:
• A $136 million increase in sales (excluding fuel revenues) to wholesale
customers primarily due to a new customer contract that began in
January 2013 and an amended capacity contract that began in May 2012;
• A $117 million increase due to revised rates in North Carolina; and
• A $24 million increase (net of fuel revenue) in GWh sales to retail customers
due to higher weather normal sales volumes to retail customers.
Operating Expenses. The variance was primarily due to:
• A $136 million decrease in operations and maintenance expenses
primarily due to lower costs associated with the merger with Duke
Energy and the levelization of nuclear outage costs; and
• A $32 million decrease in impairment charges primarily related to the
merger with Duke Energy. These charges relate to planned transmission
projects for which recovery is not expected, and certain costs associated
with mitigation sales pursuant to merger settlement agreements with the
FERC. These charges were partially offset by a current year impairment
charge resulting from the decision to suspend the application for two
proposed nuclear units at Harris.
Partially offset by:
• A $29 million increase in fuel expense (including purchased power)
primarily due to higher non-recoverable purchased power costs and
increased sales volumes, partially offset by lower fuel expense due to
generation mix as a result of retiring certain coal-fired plants and adding
one new natural gas-fired generating plant.
Other Income and Expense, net. The variance was primarily due to
lower AFUDC equity due to major projects that were placed into service in
late 2012.
Income Tax Expense. The variance was primarily due to an increase in
pretax income. The effective tax rates for the years ended December 31, 2013
and 2012 were 36.5 percent and 28.7 percent, respectively. The increase in the
effective tax rate was primarily due to the impact of lower AFUDC equity.
Matters Impacting Future Duke Energy Progress Results
An appeal of a recently approved rate case is pending at the North Carolina
Supreme Court. The NCAG and NC WARN dispute the rate of return, capital
structure and other matters approved by the NCUC. The outcome of this appeal
could have an adverse impact to Duke Energy Progress’s financial position,
results of operations and cash flows. See Note 4 to the Consolidated Financial
Statements, “Regulatory Matters,” for additional information.