Duke Energy 2013 Annual Report Download - page 25
Download and view the complete annual report
Please find page 25 of the 2013 Duke Energy annual report below. You can navigate through the pages in the report by either clicking on the pages listed below, or by using the keyword search tool below to find specific information within the annual report.-
 1
1 -
2
-
3
-
4
-
5
-
6
-
7
-
8
-
9
-
10
-
11
-
12
-
13
-
14
-
 15
15 -
 16
16 -
 17
17 -
 18
18 -
 19
19 -
 20
20 -
 21
21 -
 22
22 -
 23
23 -
 24
24 -
 25
25 -
 26
26 -
 27
27 -
 28
28 -
 29
29 -
 30
30 -
 31
31 -
 32
32 -
 33
33 -
 34
34 -
 35
35 -
36
-
37
-
38
-
39
-
40
-
41
-
42
-
43
-
44
-
45
-
46
-
47
-
48
-
49
-
50
-
51
-
52
-
53
-
54
-
55
-
56
-
57
-
58
-
59
-
60
-
61
-
62
-
63
-
64
-
65
-
66
-
67
-
68
-
69
-
70
-
71
-
72
-
73
-
74
-
75
-
76
-
77
-
78
-
79
-
80
-
81
-
82
-
83
-
84
-
85
-
86
-
87
-
88
-
89
-
90
-
91
-
92
-
93
-
94
-
95
-
96
-
97
-
98
-
99
-
100
-
101
-
102
-
103
-
104
-
105
-
106
-
107
-
108
-
109
-
110
-
111
-
112
-
113
-
114
-
115
-
116
-
117
-
118
-
119
-
120
-
121
-
122
-
123
-
124
-
125
-
126
-
127
-
128
-
129
-
130
-
131
-
132
-
133
-
134
-
135
-
136
-
137
-
138
-
139
-
140
-
141
-
142
-
143
-
144
-
145
-
146
-
147
-
148
-
149
-
150
-
151
-
152
-
153
-
154
-
155
-
156
-
157
-
158
-
159
-
160
-
161
-
162
-
163
-
164
-
165
-
166
-
167
-
168
-
169
-
170
-
171
-
172
-
173
-
174
-
175
-
176
-
177
-
178
-
179
-
180
-
181
-
182
-
183
-
184
-
185
-
186
-
187
-
188
-
189
-
190
-
191
-
192
-
193
-
194
-
195
-
196
-
197
-
198
-
199
-
200
-
201
-
202
-
203
-
204
-
205
-
206
-
207
-
208
-
209
-
210
-
211
-
212
-
213
-
214
-
215
-
216
-
217
-
218
-
219
-
220
-
221
-
222
-
223
-
224
-
225
-
226
-
227
-
228
-
229
-
230
-
231
-
232
-
233
-
234
-
235
-
236
-
237
-
238
-
239
-
240
-
241
-
242
-
243
-
244
-
245
-
246
-
247
-
248
-
249
-
250
-
251
-
252
-
253
-
254
-
255
-
256
-
257
-
258
-
259
 |
 |

PART I
7
Potential Plant Retirements
The Subsidiary Registrants periodically file Integrated Resource Plans
(IRP) with state regulatory commissions. The IRPs provide a view of forecasted
energy needs over a long term (15-20 years) and options being considered to
meet those needs. The IRPs filed by the Subsidiary Registrants in 2013 and
2012 included planning assumptions to potentially retire certain coal-fired
generating facilities earlier than their current estimated useful lives. These
facilities do not have the requisite emission control equipment, primarily to
meet U.S. Environmental Protection Agency (EPA) regulations that are not yet
effective. These facilities total approximately 2,447 MW at five sites. Duke
Energy continues to evaluate the potential need to retire these coal-fired
generating facilities earlier than the current estimated useful lives, and plans
to seek regulatory recovery for amounts that would not be otherwise recovered
when any assets are retired. For additional information related to potential plant
retirements see Note 4 to the Consolidated Financial Statements, “Regulatory
Matters.”
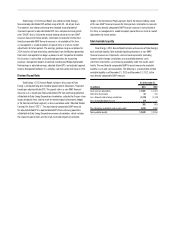
Sources of Electricity
Regulated Utilities relies principally on coal, natural gas and nuclear fuel for its generation of electricity. The following table lists sources of electricity and fuel
costs for the three years ended December 31, 2013.
Generation by Source(a)(e)
Cost of Delivered Fuel per Net
Kilowatt-hour Generated (Cents)(a)(e)
2013 2012 2011 2013 2012 2011
Coal(b) 35.7% 39.1% 52.6% 3.67 3.55 3.17
Nuclear(b) 28.7% 30.8% 33.0% 0.66 0.62 0.55
Oil and gas(b) 21.3% 14.0% 1.2% 4.18 4.03 5.89
All fuels (cost-based on weighted average)(b) 85.7% 83.9% 86.8% 2.79 2.55 2.21
Hydroelectric and solar(c) 1.5% 0.8% 0.9%
Total generation 87.2% 84.7% 87.7%
Purchased power and net interchange(d) 12.8% 15.3% 12.3%
Total sources of energy 100.0% 100.0% 100.0%
(a) Statistics include Duke Energy Progress and Duke Energy Florida beginning July 2, 2012.
(b) Statistics related to all fuels reflect Regulated Utilities’ ownership interest in jointly owned generation facilities.
(c) Generating figures are net of output required to replenish pumped storage facilities during off-peak periods.
(d) Purchased power includes renewable energy purchases.
(e) Includes the effect of the Joint Dispatch Agreement (JDA) and Mitigation Sales. Mitigation sales are excluded from the Regulated Utilities segment.
Coal
Regulated Utilities meets its coal demand through a portfolio of long-term
purchase contracts and short-term spot market purchase agreements. Large
amounts of coal are purchased under long-term contracts with mining operators
who mine both underground and at the surface. Regulated Utilities uses spot-
market purchases to meet coal requirements not met by long-term contracts.
Expiration dates for its long-term contracts, which have various price adjustment
provisions and market re-openers, range from 2014 to 2016 for Duke Energy
Carolinas, 2014 to 2018 for Duke Energy Progress, 2014 to 2016 for Duke Energy
Florida, and 2014 to 2025 for Duke Energy Indiana. Regulated Utilities expects
to renew these contracts or enter into similar contracts with other suppliers as
existing contracts expire, though prices will fluctuate over time as coal markets
change. Coal purchased for the Carolinas is primarily produced from mines in
Central Appalachia, Northern Appalachia and the Illinois Basin. Coal purchased
for Florida is primarily produced from mines in Central Appalachia and the
Illinois Basin. Coal purchased for Indiana is primarily produced in Indiana and
Illinois. Regulated Utilities has an adequate supply of coal under contract to
fuel its projected 2014 operations and a significant portion of supply to fuel its
projected 2015 operations. Coal inventory levels have begun to normalize during
the past year as weather patterns have trended closer to historical averages,
combined with improving economic indicators and higher natural gas prices,
which are resulting in higher coal-fired generation. Significantly colder than
normal temperatures in December 2013 and January 2014 continued the trend of
higher natural gas prices and increased coal-fired generation.
The current average sulfur content of coal purchased by Regulated Utilities
is between 1.5 percent and 2 percent for Duke Energy Carolinas, between
1.5 percent and 2 percent for Duke Energy Progress, between 1 percent and
2.5 percent for Duke Energy Florida, and between 2 percent and 3 percent for
Duke Energy Indiana. Regulated Utilities’ environmental controls, in combination
with the use of sulfur dioxide (SO2) emission allowances, enable Regulated
Utilities to satisfy current SO2 emission limitations for its existing facilities.
Nuclear
The industrial processes for producing nuclear generating fuel generally
involve the mining and milling of uranium ore to produce uranium concentrates,
and services to convert, enrich, and fabricate fuel assemblies.
Regulated Utilities has contracted for uranium materials and services
to fuel its nuclear reactors. Uranium concentrates, conversion services and
enrichment services are primarily met through a diversified portfolio of long-term
supply contracts. The contracts are diversified by supplier, country of origin
and pricing. Regulated Utilities staggers its contracting so that its portfolio of
long-term contracts covers the majority of its fuel requirements in the near-term
and decreasing portions of its fuel requirements over time thereafter. Near-term
requirements not met by long-term supply contracts have been and are expected
to be fulfilled with spot market purchases. Due to the technical complexities
of changing suppliers of fuel fabrication services, Regulated Utilities generally
sources these services to a single domestic supplier on a plant-by-plant basis
using multi-year contracts.
Regulated Utilities has entered into fuel contracts that cover 100 percent
of its uranium concentrates, conversion services, and enrichment services
requirements through at least 2014 and cover fabrication services requirements
for these plants through at least 2018. For future requirements not already
covered under long-term contracts, Regulated Utilities believes it will be able to
renew contracts as they expire, or enter into similar contractual arrangements
with other suppliers of nuclear fuel materials and services.
Oil and Gas
Oil and natural gas supply for Regulated Utilities’ generation fleet
is purchased under term and spot contracts from various suppliers. Duke
Energy Carolinas, Duke Energy Progress, Duke Energy Florida and Duke Energy
Indiana use derivative instruments to limit a portion of their exposure to price
fluctuations for natural gas. Regulated Utilities has dual-fuel generating facilities