Duke Energy 2013 Annual Report Download - page 63
Download and view the complete annual report
Please find page 63 of the 2013 Duke Energy annual report below. You can navigate through the pages in the report by either clicking on the pages listed below, or by using the keyword search tool below to find specific information within the annual report.-
 1
1 -
2
-
3
-
4
-
5
-
6
-
7
-
8
-
9
-
10
-
11
-
12
-
13
-
14
-
15
-
16
-
17
-
18
-
19
-
20
-
21
-
22
-
23
-
24
-
25
-
26
-
27
-
28
-
29
-
30
-
31
-
32
-
33
-
34
-
35
-
36
-
37
-
38
-
39
-
40
-
41
-
42
-
43
-
44
-
45
-
46
-
47
-
48
-
49
-
50
-
51
-
52
-
 53
53 -
 54
54 -
 55
55 -
 56
56 -
 57
57 -
 58
58 -
 59
59 -
 60
60 -
 61
61 -
 62
62 -
 63
63 -
 64
64 -
 65
65 -
 66
66 -
 67
67 -
 68
68 -
 69
69 -
 70
70 -
 71
71 -
 72
72 -
 73
73 -
74
-
75
-
76
-
77
-
78
-
79
-
80
-
81
-
82
-
83
-
84
-
85
-
86
-
87
-
88
-
89
-
90
-
91
-
92
-
93
-
94
-
95
-
96
-
97
-
98
-
99
-
100
-
101
-
102
-
103
-
104
-
105
-
106
-
107
-
108
-
109
-
110
-
111
-
112
-
113
-
114
-
115
-
116
-
117
-
118
-
119
-
120
-
121
-
122
-
123
-
124
-
125
-
126
-
127
-
128
-
129
-
130
-
131
-
132
-
133
-
134
-
135
-
136
-
137
-
138
-
139
-
140
-
141
-
142
-
143
-
144
-
145
-
146
-
147
-
148
-
149
-
150
-
151
-
152
-
153
-
154
-
155
-
156
-
157
-
158
-
159
-
160
-
161
-
162
-
163
-
164
-
165
-
166
-
167
-
168
-
169
-
170
-
171
-
172
-
173
-
174
-
175
-
176
-
177
-
178
-
179
-
180
-
181
-
182
-
183
-
184
-
185
-
186
-
187
-
188
-
189
-
190
-
191
-
192
-
193
-
194
-
195
-
196
-
197
-
198
-
199
-
200
-
201
-
202
-
203
-
204
-
205
-
206
-
207
-
208
-
209
-
210
-
211
-
212
-
213
-
214
-
215
-
216
-
217
-
218
-
219
-
220
-
221
-
222
-
223
-
224
-
225
-
226
-
227
-
228
-
229
-
230
-
231
-
232
-
233
-
234
-
235
-
236
-
237
-
238
-
239
-
240
-
241
-
242
-
243
-
244
-
245
-
246
-
247
-
248
-
249
-
250
-
251
-
252
-
253
-
254
-
255
-
256
-
257
-
258
-
259
 |
 |

45
PART II
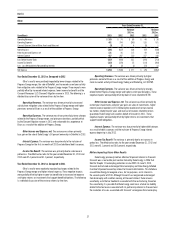
Year Ended December 31, 2013 as Compared to 2012
Operating Revenues. The variance was primarily driven by:
• A $155 million net increase primarily related to updates to the IGCC
rider, and
• A $43 million increase in fuel revenues (including emission allowances)
due to an increase in fuel rates as a result of higher fuel and purchased
power costs.
Operating Expenses. The variance was primarily driven by:
• A $600 million decrease due to 2012 impairment and other charges
related to the Edwardsport IGCC plant, and
• A $40 million decrease in depreciation expense due to a regulatory order
related to the Edwardsport IGCC settlement agreement.
Partially offset by:
• A $43 million increase in fuel costs primarily driven by higher fuel and
purchased power costs.
Other Income and Expenses, net. The variance was primarily driven
by a $70 million decrease in AFUDC equity primarily due to updates to the IGCC
rider in January 2013.
Interest Expense. The variance was primarily driven by a $30 million
decrease in AFUDC debt primarily due to updates to the IGCC rider in
January 2013.
Income Tax Expense (Benefit). The variance was primarily due to
an increase in pretax income. The effective tax rates for the years ended
December 31, 2013 and 2012 were 38.4 percent and 59.5 percent, respectively.
The decrease in the effective tax was primarily due to pretax income in 2013
compared to pretax loss in 2012 primarily resulting from the Edwardsport IGCC
project impairment and the impact of AFUDC equity in 2013 that reduced the tax
expense compared to higher AFUDC in 2012 that increased the tax benefit.
CRITICAL ACCOUNTING POLICIES AND ESTIMATES
Preparation of financial statements requires the application of accounting
policies, judgments, assumptions and estimates that can significantly affect the
reported results of operations and the amounts of assets and liabilities reported
in the financial statements. Judgments made include the likelihood of success
of particular projects, possible legal and regulatory challenges and anticipated
recovery of costs.
Management discusses these policies, estimates and assumptions with
senior members of management on a regular basis and provides periodic
updates on management decisions to the audit committee of the Duke Energy
board of directors. Management believes the areas described below require
significant judgment in the application of accounting policy or in making
estimates and assumptions that are inherently uncertain and that may change in
subsequent periods.
Regulatory Accounting
A substantial majority of Regulated Utilities, Duke Energy’s regulated
operations, meet the criteria for application of regulatory accounting treatment.
As a result, Duke Energy records assets and liabilities that would not be recorded
for nonregulated entities. Regulatory assets generally represent incurred costs
that have been deferred because such costs are probable of future recovery in
customer rates. Regulatory liabilities generally represent obligations to make
refunds, or reduce rates, to customers for previous collections or for costs that
have yet to be incurred.
Management continually assesses whether recorded regulatory assets
are probable of future recovery by considering factors such as applicable
regulatory environment changes, historical regulatory treatment for similar costs
in Duke Energy’s jurisdictions, litigation of rate orders, recent rate orders to
other regulated entities, and the status of any pending or potential deregulation
legislation. If future recovery of costs ceases to be probable, asset write-offs
would be recognized in operating income. Additionally, regulatory agencies can
provide flexibility in the manner and timing of the depreciation of property, plant
and equipment, recognition of nuclear decommissioning costs and amortization
of regulatory assets or may disallow recovery of all or a portion of certain assets.
Total regulatory assets for Duke Energy were $10,086 million and $11,741 million
as of December 31, 2013 and 2012, respectively. Total regulatory liabilities
were $6,265 million and $5,740 million as of December 31, 2013 and 2012,
respectively. For further information, see Note 4 to the Consolidated Financial
Statements, “Regulatory Matters.”
As required by regulated operations accounting, significant judgment can
be required to determine if an otherwise recognizable cost is considered to be an
entity specific cost recoverable in future rates and therefore a regulatory asset.
Significant judgment can also be required to determine if revenues previously
recognized are for entity specific costs that are no longer expected to be incurred
and are therefore a regulatory liability.
Regulatory accounting rules also require recognition of a loss if it becomes
probable that part of the cost of a plant under construction (or a recently
completed plant or an abandoned plant) will be disallowed for ratemaking
purposes and a reasonable estimate of the amount of the disallowance can be
made. For example, if a cost cap is set, the amount of the disallowance is a
result of a judgment as to the ultimate cost of the plant. Other disallowances can
require judgments on allowed future rate recovery. As discussed in Note 4
to the Consolidated Financial Statements, “Regulatory Matters,” during 2012 and
2011 Duke Energy Indiana recorded charges of $631 million and $222 million,
respectively, related to the Edwardsport IGCC plant. In 2013, Duke Energy
Florida recorded a charge of $295 million related to the retired Crystal River
Unit 3 Nuclear Station. Also as discussed in Note 2 to the Consolidated Financial
Statements, “Acquisitions and Sales of Other Assets”, Duke Energy Carolinas
and Duke Energy Progress recorded disallowance charges in 2012 in order to
gain FERC approval of the merger between Duke Energy and Progress Energy.
Duke Energy Carolinas and Duke Energy Progress guaranteed total fuel savings
to customers in North Carolina and South Carolina of $687 million over the
five years in order to gain NCUC and SCPSC approval of the merger between
Duke Energy and Progress Energy. Based on current estimates of future fuel
costs, Duke Energy anticipates that it will meet the guaranteed fuel savings.
However, if actual fuel costs are higher than expected, Duke Energy could record
a charge for the unmet guaranteed savings.
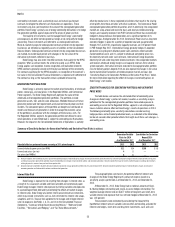
Goodwill Impairment Assessments
Duke Energy’s goodwill balances by segment are included in the following
table.
December 31,
(in millions) 2013 2012
Regulated Utilities $15,950 $ 15,950
International Energy 326 353
Commercial Power 64 62
Total Duke Energy goodwill $16,340 $ 16,365