Duke Energy 2013 Annual Report Download - page 119
Download and view the complete annual report
Please find page 119 of the 2013 Duke Energy annual report below. You can navigate through the pages in the report by either clicking on the pages listed below, or by using the keyword search tool below to find specific information within the annual report.
101
PART II
DUKE ENERGY CORPORATION • DUKE ENERGY CAROLINAS, LLC • PROGRESS ENERGY, INC. •
DUKE ENERGY PROGRESS, INC. • DUKE ENERGY FLORIDA, INC. • DUKE ENERGY OHIO, INC. • DUKE ENERGY INDIANA, INC.
Combined Notes to Consolidated Financial Statements – (Continued)
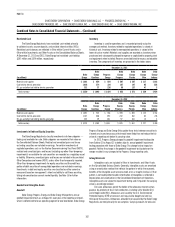
Sheets of the Duke Energy Registrants at December 31, 2013 and 2012. The
amounts presented exceeded 5 percent of current assets or 5 percent of current
liabilities unless otherwise noted.
December 31,
(in millions) Location 2013 2012
Duke Energy
Accrued compensation Current Liabilities $ 621 $ 725
Duke Energy Carolinas
Accrued compensation Current Liabilities $ 198 $ 203
Collateral liabilities Current Liabilities 120 105
Progress Energy
Customer deposits Current Liabilities $ 349 $342
Accrued compensation Current Liabilities 214 304
Derivative liabilities Current Liabilities — 221
Duke Energy Progress
Customer deposits Current Liabilities $ 129 $ 120
Accrued compensation Current Liabilities 121 160
Duke Energy Florida
Customer deposits Current Liabilities $ 220 $ 222
Accrued compensation Current Liabilities 65 95
Derivative liabilities Current Liabilities — 127
Duke Energy Ohio
Collateral assets Current Assets $ 122 $ 99
Duke Energy Indiana
Federal income taxes receivable Current Assets $ 56 $ —
Accrued compensation(a) Current Liabilities 25 23
Collateral liabilities(a) Current Liabilities 40 37
Derivative liabilities Current Liabilities — 63
(a) Does not exceed 5 percent of Total current liabilities on the Consolidated Balance Sheets at
December 31, 2012.
Preferred Stock
In March 2013, Duke Energy Progress and Duke Energy Florida redeemed
all series of their outstanding preferred stock at prices ranging from $101.00
to $110.00 per share for Duke Energy Progress and $101.00 to $104.25 per
share for Duke Energy Florida plus accrued dividends for all series. Duke Energy
Progress and Duke Energy Florida redeemed the shares for $62 million and
$34 million, respectively.
Discontinued Operations
For the year ended December 31, 2013, Duke Energy’s and Progress
Energy’s Income From Discontinued Operations, net of tax was primarily due
to tax benets related to prior sales of diversied businesses. For the year
ended December 31, 2012, Duke Energy’s and Progress Energy’s Income
From Discontinued Operations, net of tax was primarily related to resolution of
litigation associated with Progress Energy’s former synthetic fuel operations
and reversal of certain environmental indemnication liabilities for which the
indemnication period expired during 2012. See Note 5 for more information
regarding the former synthetic fuel operations.
Amounts Attributable to Controlling Interests
Income From Discontinued Operations, net of tax presented on the
respective Consolidated Statements of Operations for Duke Energy and
Progress Energy is attributable to controlling interests for all periods presented.
Other comprehensive income presented on Progress Energy’s Consolidated
Statements of Operations and Comprehensive Income are attributable to
controlling interests for all periods presented.
SIGNIFICANT ACCOUNTING POLICIES
Use of Estimates
In preparing nancial statements that conform to generally accepted
accounting principles (GAAP) in the U.S., the Duke Energy Registrants must
make estimates and assumptions that affect the reported amounts of assets
and liabilities, the reported amounts of revenues and expenses, and the
disclosure of contingent assets and liabilities at the date of the nancial
statements. Actual results could differ from those estimates.
Regulatory Accounting
The majority of the Duke Energy Registrants’ operations are subject to
price regulation for the sale of electricity and gas by state utility commissions
or FERC. When prices are set on the basis of specic costs of the regulated
operations and an effective franchise is in place such that sufcient gas or
electric services can be sold to recover those costs, the Duke Energy Registrants
apply regulatory accounting. Regulatory accounting changes the timing of the
recognition of costs or revenues relative to a company that does not apply
regulatory accounting. As a result, Regulatory assets and Regulatory liabilities
are recognized on the Consolidated Balance Sheets. Regulatory assets and
liabilities are amortized consistent with the treatment of the related cost in the
ratemaking process. See Note 4 for further information.
Regulated Fuel Costs and Purchased Power
The Duke Energy Registrants utilize cost-tracking mechanisms, commonly
referred to as fuel adjustment clauses. These clauses allow for the recovery
of fuel and fuel-related costs and portions of purchased power costs through
surcharges on customer rates. The difference between the costs incurred and
the surcharge revenues is recorded as an adjustment to Fuel used in electric
generation and purchased power — regulated or Operating Revenues –
Regulated electric on the Consolidated Statements of Operations with an
off-setting impact on regulatory assets or liabilities.
Cash and Cash Equivalents
All highly liquid investments with maturities of three months or less at
the date of acquisition are considered cash equivalents. At December 31, 2013,
$1,086 million of Duke Energy’s total cash and cash equivalents is held by
entities domiciled in foreign jurisdictions and is forecasted to be used to fund
international operations and investments.


