Duke Energy 2013 Annual Report Download - page 13
Download and view the complete annual report
Please find page 13 of the 2013 Duke Energy annual report below. You can navigate through the pages in the report by either clicking on the pages listed below, or by using the keyword search tool below to find specific information within the annual report.-
 1
1 -
 2
2 -
 3
3 -
 4
4 -
 5
5 -
 6
6 -
 7
7 -
 8
8 -
 9
9 -
 10
10 -
 11
11 -
 12
12 -
 13
13 -
 14
14 -
 15
15 -
 16
16 -
 17
17 -
 18
18 -
 19
19 -
 20
20 -
 21
21 -
 22
22 -
 23
23 -
 24
24 -
 25
25 -
 26
26 -
 27
27 -
 28
28 -
 29
29 -
 30
30 -
 31
31 -
 32
32 -
 33
33 -
 34
34 -
 35
35 -
 36
36 -
 37
37 -
 38
38 -
 39
39 -
 40
40 -
 41
41 -
 42
42 -
 43
43 -
 44
44 -
 45
45 -
 46
46 -
 47
47 -
 48
48 -
 49
49 -
 50
50 -
 51
51 -
 52
52 -
 53
53 -
 54
54 -
 55
55 -
 56
56 -
 57
57 -
 58
58 -
 59
59 -
 60
60 -
 61
61 -
 62
62 -
 63
63 -
 64
64 -
 65
65 -
 66
66 -
 67
67 -
 68
68 -
 69
69 -
 70
70 -
 71
71 -
 72
72 -
 73
73 -
 74
74 -
 75
75 -
 76
76 -
 77
77 -
 78
78 -
 79
79 -
 80
80 -
 81
81 -
 82
82 -
 83
83 -
 84
84 -
 85
85 -
 86
86 -
 87
87 -
 88
88 -
 89
89 -
 90
90 -
 91
91 -
 92
92 -
 93
93 -
 94
94 -
 95
95 -
 96
96 -
 97
97 -
 98
98 -
 99
99 -
 100
100 -
 101
101 -
 102
102 -
 103
103 -
 104
104 -
 105
105 -
 106
106 -
 107
107 -
 108
108 -
 109
109 -
 110
110 -
 111
111 -
 112
112 -
 113
113 -
 114
114 -
 115
115 -
 116
116 -
 117
117 -
 118
118 -
 119
119 -
 120
120 -
 121
121 -
 122
122 -
 123
123 -
 124
124 -
 125
125 -
 126
126 -
 127
127 -
 128
128 -
 129
129 -
 130
130 -
 131
131 -
 132
132 -
 133
133 -
 134
134 -
 135
135 -
 136
136 -
 137
137 -
 138
138 -
 139
139 -
 140
140 -
 141
141 -
 142
142 -
 143
143 -
 144
144 -
 145
145 -
 146
146 -
 147
147 -
 148
148 -
 149
149 -
 150
150 -
 151
151 -
 152
152 -
 153
153 -
 154
154 -
 155
155 -
 156
156 -
 157
157 -
 158
158 -
 159
159 -
 160
160 -
 161
161 -
 162
162 -
 163
163 -
 164
164 -
 165
165 -
 166
166 -
 167
167 -
 168
168 -
 169
169 -
 170
170 -
 171
171 -
 172
172 -
 173
173 -
 174
174 -
 175
175 -
 176
176 -
 177
177 -
 178
178 -
 179
179 -
 180
180 -
 181
181 -
 182
182 -
 183
183 -
 184
184 -
 185
185 -
 186
186 -
 187
187 -
 188
188 -
 189
189 -
 190
190 -
 191
191 -
 192
192 -
 193
193 -
 194
194 -
 195
195 -
 196
196 -
 197
197 -
 198
198 -
 199
199 -
 200
200 -
 201
201 -
 202
202 -
 203
203 -
 204
204 -
 205
205 -
 206
206 -
 207
207 -
 208
208 -
 209
209 -
 210
210 -
 211
211 -
 212
212 -
 213
213 -
 214
214 -
 215
215 -
 216
216 -
 217
217 -
 218
218 -
 219
219 -
 220
220 -
 221
221 -
 222
222 -
 223
223 -
 224
224 -
 225
225 -
 226
226 -
 227
227 -
 228
228 -
 229
229 -
 230
230 -
 231
231 -
 232
232 -
 233
233 -
 234
234 -
 235
235 -
 236
236 -
 237
237 -
 238
238 -
 239
239 -
 240
240 -
 241
241 -
 242
242 -
 243
243 -
 244
244 -
 245
245 -
 246
246 -
 247
247 -
 248
248 -
 249
249 -
 250
250 -
 251
251 -
 252
252 -
 253
253 -
 254
254 -
 255
255 -
 256
256 -
 257
257 -
 258
258 -
 259
259
 |
 |

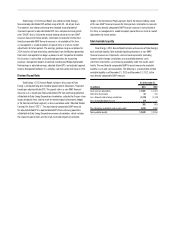
DUKE ENERGY AT A GLANCE
2013 ANNUAL REPORT
l
11
REGULATED UTILITIES
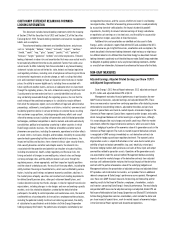
Generation Diversity (percent owned capacity)1Generation Diversity (percent owned capacity)1
Generated (net output gigawatt-hours (GWh))2
Customer Diversity (in billed GWh sales) 2
COMMERCIAL POWER
Regulated Utilities consists of Duke Energy’s regulated
generation, electric and natural gas transmission and
distribution systems. Regulated Utilities generation portfolio is
a balanced mix of energy resources having different operating
characteristics and fuel sources designed to provide energy at
the lowest possible cost.
Electric Operations
Owns approximately 49,600 megawatts (MW) of
generating capacity
Service area covers about 104,000 square miles with
an estimated population of 21 million
Service to approximately 7.2 million residential,
commercial and industrial customers
261,700 miles of distribution lines and a
32,300-mile transmission system
Gas Operations
Regulated natural gas transmission and distribution services
to approximately 500,000 customers in southwestern Ohio
and northern Kentucky
Commercial Power owns, operates and manages power plants,
primarily located in the Midwest, and a renewable energy portfolio.
Commercial Power’s subsidiary, Duke Energy Retail, serves retail
electric customers primarily in Ohio with generation and other energy
services at competitive rates. Through Duke Energy Generation
Services, Inc., Commercial Power engages in the development,
construction and operation of renewable energy projects.
Owns and operates a balanced generation portfolio of
approximately 6,600 net MW of power generation (excluding
wind and solar generation assets)3
Duke Energy Renewables currently has approximately 1,800
MW of wind and solar energy in operation (pie chart excludes
440 MW, which are from equity investments), and has a
signicant pipeline of development projects
40%
Coal
36%
Natural
Gas/Fuel
Oil
17%
Nuclear
7%
Hydro
41%
Coal
3 3 %
Nuclear
2 4 %
Natural
Gas/Fuel
Oil
2%
Hydro
and
Solar
43%
Natural
Gas
41%
Coal
16%
Renewable
3 3 %
Residential
31%
General
Services
21%
Industrial
1 5 %
Wholesale/Other
Generation Diversity (percent owned capacity)1
INTERNATIONAL ENERGY
International Energy operates and manages power generation
facilities and engages in sales and marketing of electric power
and natural gas outside the U.S. International Energy’s activities
target power generation in Latin America. International Energy
also has an equity investment in National Methanol Co., a Saudi
Arabian regional producer of MTBE, a gasoline additive.
Owns, operates or has substantial interests in approximately
4,600 net MW of generation facilities
Nearly two-thirds of International Energy’s generating
capacity is hydroelectric
66%
Hydro
2 2 %
Fuel
Oil
10%
Natural
Gas
2%
Coal
REGULATED
UTILITIES
COMMERCIAL
POWER
INTERNATIONAL
ENERGY
1
As of December 31, 2013
2
For the year-ended December 31, 2013
3
The company announced in February 2014 it has begun the process to exit all of its unregulated generation in Ohio, Illinois and Pennsylvania.
