Duke Energy 2013 Annual Report Download - page 187
Download and view the complete annual report
Please find page 187 of the 2013 Duke Energy annual report below. You can navigate through the pages in the report by either clicking on the pages listed below, or by using the keyword search tool below to find specific information within the annual report.-
 1
1 -
2
-
3
-
4
-
5
-
6
-
7
-
8
-
9
-
10
-
11
-
12
-
13
-
14
-
15
-
16
-
17
-
18
-
19
-
20
-
21
-
22
-
23
-
24
-
25
-
26
-
27
-
28
-
29
-
30
-
31
-
32
-
33
-
34
-
35
-
36
-
37
-
38
-
39
-
40
-
41
-
42
-
43
-
44
-
45
-
46
-
47
-
48
-
49
-
50
-
51
-
52
-
53
-
54
-
55
-
56
-
57
-
58
-
59
-
60
-
61
-
62
-
63
-
64
-
65
-
66
-
67
-
68
-
69
-
70
-
71
-
72
-
73
-
74
-
75
-
76
-
77
-
78
-
79
-
80
-
81
-
82
-
83
-
84
-
85
-
86
-
87
-
88
-
89
-
90
-
91
-
92
-
93
-
94
-
95
-
96
-
97
-
98
-
99
-
100
-
101
-
102
-
103
-
104
-
105
-
106
-
107
-
108
-
109
-
110
-
111
-
112
-
113
-
114
-
115
-
116
-
117
-
118
-
119
-
120
-
121
-
122
-
123
-
124
-
125
-
126
-
127
-
128
-
129
-
130
-
131
-
132
-
133
-
134
-
135
-
136
-
137
-
138
-
139
-
140
-
141
-
142
-
143
-
144
-
145
-
146
-
147
-
148
-
149
-
150
-
151
-
152
-
153
-
154
-
155
-
156
-
157
-
158
-
159
-
160
-
161
-
162
-
163
-
164
-
165
-
166
-
167
-
168
-
169
-
170
-
171
-
172
-
173
-
174
-
175
-
176
-
 177
177 -
 178
178 -
 179
179 -
 180
180 -
 181
181 -
 182
182 -
 183
183 -
 184
184 -
 185
185 -
 186
186 -
 187
187 -
 188
188 -
 189
189 -
 190
190 -
 191
191 -
 192
192 -
 193
193 -
 194
194 -
 195
195 -
 196
196 -
 197
197 -
198
-
199
-
200
-
201
-
202
-
203
-
204
-
205
-
206
-
207
-
208
-
209
-
210
-
211
-
212
-
213
-
214
-
215
-
216
-
217
-
218
-
219
-
220
-
221
-
222
-
223
-
224
-
225
-
226
-
227
-
228
-
229
-
230
-
231
-
232
-
233
-
234
-
235
-
236
-
237
-
238
-
239
-
240
-
241
-
242
-
243
-
244
-
245
-
246
-
247
-
248
-
249
-
250
-
251
-
252
-
253
-
254
-
255
-
256
-
257
-
258
-
259
 |
 |

169
PART II
DUKE ENERGY CORPORATION • DUKE ENERGY CAROLINAS, LLC • PROGRESS ENERGY, INC. •
DUKE ENERGY PROGRESS, INC. • DUKE ENERGY FLORIDA, INC. • DUKE ENERGY OHIO, INC. • DUKE ENERGY INDIANA, INC.
Combined Notes to Consolidated Financial Statements – (Continued)
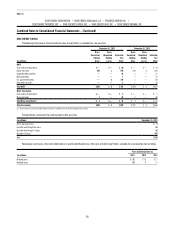
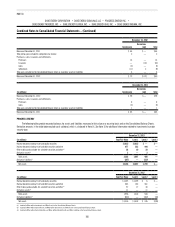
DUKE ENERGY OHIO
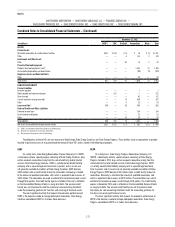
The following tables provide recorded balances for assets and liabilities measured at fair value on a recurring basis on the Consolidated Balance Sheets.
Derivative amounts in the table below exclude cash collateral, which are disclosed in Note 14.
December 31, 2013
(in millions) Total Fair Value Level 1 Level 2 Level 3
Derivative assets(a) $ 96 $ 50 $ 21 $ 25
Derivative liabilities(b) (95) (1) (65) (29)
Net assets (liabilities) $ 1 $ 49 $ (44) $ (4)
December 31, 2012
(in millions) Total Fair Value Level 1 Level 2 Level 3
Derivative assets(a) $ 59 $ 48 $ 2 $ 9
Derivative liabilities(b) (38) (15) (8) (15)
Net assets (liabilities) $ 21 $ 33 $ (6) $ (6)
(a) Included in Other within Current Assets and Other within Investments and Other Assets in the Consolidated Balance Sheets.
(b) Included in Other within Current Liabilities and Other within Deferred Credits and Other Liabilities in the Consolidated Balance Sheets.
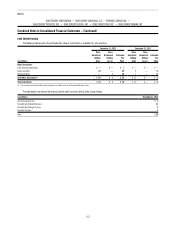
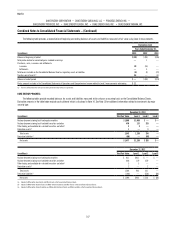
The following table provides a reconciliation of beginning and ending balances of assets and liabilities measured at fair value using Level 3 measurements.
Derivatives (net)
Years Ended December 31,
(in millions) 2013 2012 2011
Balance at beginning of period $ (6) $ (3) $ 13
Total pretax realized or unrealized gains included in earnings(a) (42) (3) (4)
Purchases, sales, issuances and settlements:
Purchases 1 — —
Settlements — 1 (14)
Total losses included on the Consolidated Balance Sheet as regulatory assets or liabilities —(1) 2
Transfers out of Level 3(b) 43 — —
Balance at end of period $ (4) $ (6) $ (3)
(a) Amounts for derivative are primarily included in Operating Revenues.
(b) Transfers reflect derivative contracts becoming observable due to the passage of time.
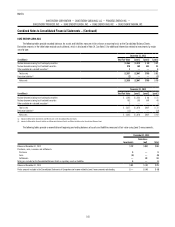
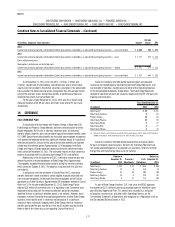
DUKE ENERGY INDIANA
The following tables provide recorded balances for assets and liabilities measured at fair value on a recurring basis on the Consolidated Balance Sheets.
Derivative amounts in the table below exclude cash collateral, which is disclosed in Note 14. See Note 15 for additional information related to investments by major
security type.
December 31, 2013
(in millions) Total Fair Value Level 1 Level 2 Level 3
Available-for-sale equity securities(a) $ 65 $ 65 $ — $—
Available-for-sale debt securities(a) 29 — 29 —
Derivative assets(b) 12 — — 12
Net assets (liabilities) $106 $ 65 $ 29 $ 12