Duke Energy 2013 Annual Report Download - page 165
Download and view the complete annual report
Please find page 165 of the 2013 Duke Energy annual report below. You can navigate through the pages in the report by either clicking on the pages listed below, or by using the keyword search tool below to find specific information within the annual report.-
 1
1 -
2
-
3
-
4
-
5
-
6
-
7
-
8
-
9
-
10
-
11
-
12
-
13
-
14
-
15
-
16
-
17
-
18
-
19
-
20
-
21
-
22
-
23
-
24
-
25
-
26
-
27
-
28
-
29
-
30
-
31
-
32
-
33
-
34
-
35
-
36
-
37
-
38
-
39
-
40
-
41
-
42
-
43
-
44
-
45
-
46
-
47
-
48
-
49
-
50
-
51
-
52
-
53
-
54
-
55
-
56
-
57
-
58
-
59
-
60
-
61
-
62
-
63
-
64
-
65
-
66
-
67
-
68
-
69
-
70
-
71
-
72
-
73
-
74
-
75
-
76
-
77
-
78
-
79
-
80
-
81
-
82
-
83
-
84
-
85
-
86
-
87
-
88
-
89
-
90
-
91
-
92
-
93
-
94
-
95
-
96
-
97
-
98
-
99
-
100
-
101
-
102
-
103
-
104
-
105
-
106
-
107
-
108
-
109
-
110
-
111
-
112
-
113
-
114
-
115
-
116
-
117
-
118
-
119
-
120
-
121
-
122
-
123
-
124
-
125
-
126
-
127
-
128
-
129
-
130
-
131
-
132
-
133
-
134
-
135
-
136
-
137
-
138
-
139
-
140
-
141
-
142
-
143
-
144
-
145
-
146
-
147
-
148
-
149
-
150
-
151
-
152
-
153
-
154
-
 155
155 -
 156
156 -
 157
157 -
 158
158 -
 159
159 -
 160
160 -
 161
161 -
 162
162 -
 163
163 -
 164
164 -
 165
165 -
 166
166 -
 167
167 -
 168
168 -
 169
169 -
 170
170 -
 171
171 -
 172
172 -
 173
173 -
 174
174 -
 175
175 -
176
-
177
-
178
-
179
-
180
-
181
-
182
-
183
-
184
-
185
-
186
-
187
-
188
-
189
-
190
-
191
-
192
-
193
-
194
-
195
-
196
-
197
-
198
-
199
-
200
-
201
-
202
-
203
-
204
-
205
-
206
-
207
-
208
-
209
-
210
-
211
-
212
-
213
-
214
-
215
-
216
-
217
-
218
-
219
-
220
-
221
-
222
-
223
-
224
-
225
-
226
-
227
-
228
-
229
-
230
-
231
-
232
-
233
-
234
-
235
-
236
-
237
-
238
-
239
-
240
-
241
-
242
-
243
-
244
-
245
-
246
-
247
-
248
-
249
-
250
-
251
-
252
-
253
-
254
-
255
-
256
-
257
-
258
-
259
 |
 |

147
PART II
DUKE ENERGY CORPORATION • DUKE ENERGY CAROLINAS, LLC • PROGRESS ENERGY, INC. •
DUKE ENERGY PROGRESS, INC. • DUKE ENERGY FLORIDA, INC. • DUKE ENERGY OHIO, INC. • DUKE ENERGY INDIANA, INC.
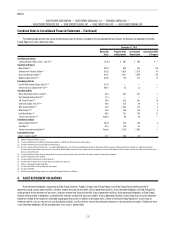
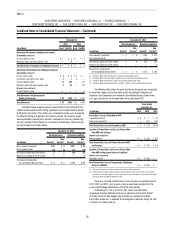
Combined Notes to Consolidated Financial Statements – (Continued)
December 31,
2013 2012
(in millions) Asset Liability Asset Liability
Derivatives Not Designated as Hedging Instruments
Commodity contracts
Current liabilities: other $— $ 1 $— $ 6
Deferred credits and other liabilities: other — 1 — 6
Total Derivatives Not Designated as Hedging
Instruments $— $ 2 $— $ 12
Total Derivatives $— $ 2 $— $ 12
The tables below show the balance sheet location of derivative contracts
subject to enforceable master netting agreements and include collateral
posted to offset the net position. This disclosure is intended to enable users to
evaluate the effect of netting arrangements on financial position. The amounts
shown were calculated by counterparty. Accounts receivable or accounts
payable may also be available to offset exposures in the event of bankruptcy.
These amounts are not included in the tables below.
December 31, 2013
Derivative Assets Derivative Liabilities
(in millions) Current(a)
Non-
Current(b) Current(c)
Non-
Current(d)
Amounts not subject to master netting $ — $— $1 $1
Net amounts recognized on
the Consolidated Balance Sheet $— $— $1 $1
December 31, 2012
Derivative Assets Derivative Liabilities
(in millions) Current(a)
Non-
Current(b) Current(c)
Non-
Current(d)
Amounts not subject to master netting $ — $— $6 $6
Net amounts recognized on
the Consolidated Balance Sheet $— $— $6 $6
(a) Included in Other within Current Assets on the Consolidated Balance Sheet.
(b) Included in Other within Investments and Other Assets on the Consolidated Balance Sheet.
(c) Included in Other within Current Liabilities on the Consolidated Balance Sheet.
(d) Included in Other within Deferred Credits and Other Liabilities on the Consolidated Balance Sheet.
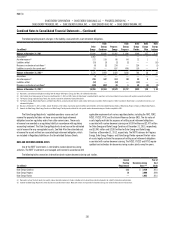
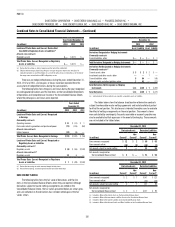
The following table shows the gains and losses during the year recognized
on cash flow hedges and the line items on the Consolidated Statements of
Operations and Comprehensive Income where such gains and losses are
included when reclassified from AOCI.
Losses on cash flow hedges reclassified at Duke Energy Carolinas during
the year ended December 31, 2013 and 2012 were not material.
Years Ended
December 31,
(in millions) 2013 2012 2011
Location of Pretax Gains and (Losses) Reclassified from AOCI
into Earnings
Interest rate contracts
Interest expense $(3) $(3) $(5)
Total Pretax Gains (Losses) Reclassified from AOCI
into Earnings $(3) $(3) $(5)
For the years ended December 31, 2013, Duke Energy Carolinas had
$23 million of pretax deferred net losses on settled interest rate cash flow
hedges remaining in AOCI. A $5 million pretax gain is expected to be recognized
in earnings during the next 12 months as interest expense.
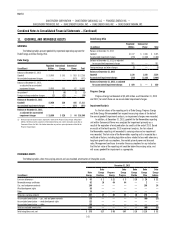
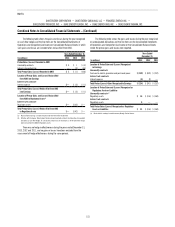
The following table shows the gains and losses during the year recognized
on undesignated derivatives and the line items on the Consolidated Statements
of Operations or the Consolidated Balance Sheets where the pretax gains and
losses were reported.
Years Ended
December 31,
(in millions) 2013 2012 2011
Location of Pretax Gains and (Losses) Recognized
in Earnings
Commodity contracts
Revenue: Regulated electric $(12) $(12) $ —
Total Pretax (Losses) Gains Recognized in Earnings $(12) $(12)$ —
Location of Pretax Gains and (Losses) Recognized
as Regulatory Assets or Liabilities
Interest rate contracts
Regulatory assets $ — $ — $ (94)
Regulatory liabilities —— (60)
Total Pretax Gains (Losses) Recognized as Regulatory
Assets or Liabilities $ — $ — $(154)
PROGRESS ENERGY
The following table shows the fair value of derivatives and the line items in
the Consolidated Balance Sheets where they are reported. Although derivatives
subject to master netting arrangements are netted on the Consolidated Balance
Sheets, the fair values presented below are shown gross and cash collateral on
the derivatives has not been netted against the fair values shown.