Duke Energy 2013 Annual Report Download - page 51
Download and view the complete annual report
Please find page 51 of the 2013 Duke Energy annual report below. You can navigate through the pages in the report by either clicking on the pages listed below, or by using the keyword search tool below to find specific information within the annual report.
33
PART II
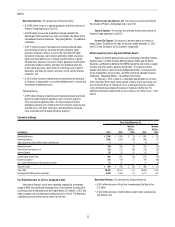
Operating Expenses. The variance was driven primarily by:
• A $3,845 million increase in operating expenses due to the inclusion of
Progress Energy beginning in July 2012;
• A $378 million increase due to additional charges related to the
Edwardsport IGCC plant that was under construction. See Note 4 to the
Consolidated Financial Statements, “Regulatory Matters,” for additional
information;
• A $277 million increase in fuel expense (including purchased power
and natural gas purchases for resale) primarily related to higher
purchases of power in Ohio as a result of the new Ohio ESP, higher
volumes of natural gas used in electric generation, higher coal prices,
higher purchased power costs in Indiana and the Carolinas, partially
offset by lower volume of coal used in electric generation resulting from
unfavorable weather conditions and lower coal-fired generation due
to low natural gas prices, lower prices for natural gas used in electric
generation, and lower gas volumes and prices to full-service retail gas
customers; and
• A $105 million increase in depreciation and amortization primarily due
to increases in depreciation as a result of additional plant in service and
amortization of regulatory assets.
Partially offset by:
• A $99 million decrease in operating and maintenance expense primarily
due to the establishment of regulatory assets in the first quarter of
2012, pursuant to regulatory orders, for future recovery of certain
employee severance costs related to the 2010 voluntary severance plan
and other costs, and lower storm costs, partially offset by increased
costs associated with the energy-efficiency programs.
Other Income and Expense, net. The variance was driven primarily by
the inclusion of Progress Energy beginning in July 2012.
Interest Expense. The variance was primarily driven by the inclusion of
Progress Energy beginning in July 2012.
Income Tax Expense. The variance is primarily due to an increase in
pretax income. The effective tax rates for the years ended December 31, 2012
and 2011 were 35 percent and 36.3 percent, respectively.
Matters Impacting Future Regulated Utilities Results
Appeals of recently approved rate cases are pending at the North Carolina
Supreme Court. The North Carolina Attorney General (NCAG) and NC Waste
Awareness and Reduction Network (NC WARN) dispute the rate of return, capital
structure and other matters approved by the NCUC. The outcome of these
appeals could have an adverse impact to Regulated Utilities’ financial position,
results of operations and cash flows. See Note 4 to the Consolidated Financial
Statements, “Regulatory Matters,” for additional information.
On February 2, 2014, a break in a stormwater pipe beneath an ash basin
at the retired Dan River steam station caused a release of ash basin water and
ash into the Dan River. On February 8, 2014, a permanent plug was installed
in the stormwater pipe stopping the release of materials into the river. For
additional information related to the ash basin release, see “Other Issues” in this
section.
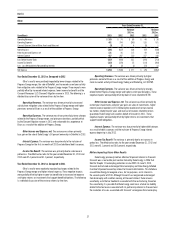
International Energy
Years Ended December 31,
(in millions) 2013 2012
Variance
2013 vs.
2012 2011
Variance
2012 vs.
2011
Operating Revenues $ 1,546 $ 1,549 $ (3) $ 1,467 $ 82
Operating Expenses 1,000 1,043 (43) 946 97
Gains (Losses) on Sales of Other Assets and Other, net 3 — 3 (1) 1
Operating Income 549 506 43 520 (14)
Other Income and Expense, net 125 171 (46) 203 (32)
Interest Expense 86 76 10 47 29
Income Before Income Taxes 588 601 (13) 676 (75)
Income Tax Expense 166 149 17 195 (46)
Less: Income Attributable to Noncontrolling Interests 14 13 1 15 (2)
Segment Income $ 408 $ 439 $ (31) $ 466 $ (27)
Sales, GWh 20,306 20,132 174 18,889 1,243
Net proportional MW capacity in operation 4,600 4,584 16 4,277 307
Year Ended December 31, 2013 as Compared to 2012
International Energy’s results were negatively impacted by an extended
outage at NMC and unfavorable exchange rates in Latin America, partially offset
by the acquisition of Iberoamericana de Energía Ibener, S.A. (Ibener) in 2012 and
higher average prices and lower purchased power costs in Brazil. The following is
a detailed discussion of the variance drivers by line item.
Operating Revenues. The variance was driven primarily by:
• A $67 million decrease in Brazil due to weakening of the Real to the
U.S. dollar,
• A $53 million decrease in Central America due to lower average prices
and volumes, and


