Duke Energy 2013 Annual Report Download - page 188
Download and view the complete annual report
Please find page 188 of the 2013 Duke Energy annual report below. You can navigate through the pages in the report by either clicking on the pages listed below, or by using the keyword search tool below to find specific information within the annual report.-
 1
1 -
2
-
3
-
4
-
5
-
6
-
7
-
8
-
9
-
10
-
11
-
12
-
13
-
14
-
15
-
16
-
17
-
18
-
19
-
20
-
21
-
22
-
23
-
24
-
25
-
26
-
27
-
28
-
29
-
30
-
31
-
32
-
33
-
34
-
35
-
36
-
37
-
38
-
39
-
40
-
41
-
42
-
43
-
44
-
45
-
46
-
47
-
48
-
49
-
50
-
51
-
52
-
53
-
54
-
55
-
56
-
57
-
58
-
59
-
60
-
61
-
62
-
63
-
64
-
65
-
66
-
67
-
68
-
69
-
70
-
71
-
72
-
73
-
74
-
75
-
76
-
77
-
78
-
79
-
80
-
81
-
82
-
83
-
84
-
85
-
86
-
87
-
88
-
89
-
90
-
91
-
92
-
93
-
94
-
95
-
96
-
97
-
98
-
99
-
100
-
101
-
102
-
103
-
104
-
105
-
106
-
107
-
108
-
109
-
110
-
111
-
112
-
113
-
114
-
115
-
116
-
117
-
118
-
119
-
120
-
121
-
122
-
123
-
124
-
125
-
126
-
127
-
128
-
129
-
130
-
131
-
132
-
133
-
134
-
135
-
136
-
137
-
138
-
139
-
140
-
141
-
142
-
143
-
144
-
145
-
146
-
147
-
148
-
149
-
150
-
151
-
152
-
153
-
154
-
155
-
156
-
157
-
158
-
159
-
160
-
161
-
162
-
163
-
164
-
165
-
166
-
167
-
168
-
169
-
170
-
171
-
172
-
173
-
174
-
175
-
176
-
177
-
 178
178 -
 179
179 -
 180
180 -
 181
181 -
 182
182 -
 183
183 -
 184
184 -
 185
185 -
 186
186 -
 187
187 -
 188
188 -
 189
189 -
 190
190 -
 191
191 -
 192
192 -
 193
193 -
 194
194 -
 195
195 -
 196
196 -
 197
197 -
 198
198 -
199
-
200
-
201
-
202
-
203
-
204
-
205
-
206
-
207
-
208
-
209
-
210
-
211
-
212
-
213
-
214
-
215
-
216
-
217
-
218
-
219
-
220
-
221
-
222
-
223
-
224
-
225
-
226
-
227
-
228
-
229
-
230
-
231
-
232
-
233
-
234
-
235
-
236
-
237
-
238
-
239
-
240
-
241
-
242
-
243
-
244
-
245
-
246
-
247
-
248
-
249
-
250
-
251
-
252
-
253
-
254
-
255
-
256
-
257
-
258
-
259
 |
 |

170
PART II
DUKE ENERGY CORPORATION • DUKE ENERGY CAROLINAS, LLC • PROGRESS ENERGY, INC. •
DUKE ENERGY PROGRESS, INC. • DUKE ENERGY FLORIDA, INC. • DUKE ENERGY OHIO, INC. • DUKE ENERGY INDIANA, INC.
Combined Notes to Consolidated Financial Statements – (Continued)
December 31, 2012
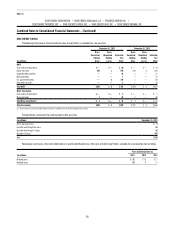
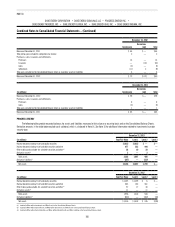
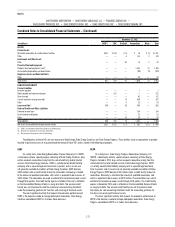
(in millions) Total Fair Value Level 1 Level 2 Level 3
Available-for-sale equity securities(a) $ 49 $ 49 $ — $—
Available-for-sale debt securities(a) 29 — 29 —
Derivative assets(b) 10 — — 10
Total assets 88 49 29 10
Derivative liabilities(c) (63) — (63) —
Net assets (liabilities) $ 25 $ 49 $ (34) $ 10
(a) Included in Other within Investments and Other Assets on the Consolidated Balance Sheets.
(b) Included in Other within Current Assets on the Consolidated Balance Sheets.
(c) Included in Other within Current Liabilities and Other within Deferred Credits and Other Liabilities on the Consolidated Balance Sheets.
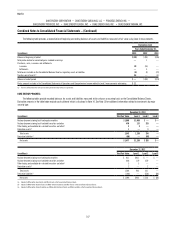
The following table provides a reconciliation of beginning and ending balances of assets and liabilities measured at fair value using Level 3 measurements.
Derivatives (net)
Years Ended December 31,
(in millions) 2013 2012 2011
Balance at beginning of period $ 10 $ 4 $ 4
Total pretax realized or unrealized gains included in earnings(a) 8 36 14
Purchases, sales, issuances and settlements:
Purchases 20 — 8
Sales — 22 —
Settlements (30) (52) (21)
Total losses included on the Consolidated Balance Sheet as regulatory assets or liabilities 4 — (1)
Balance at end of period $ 12 $ 10 $ 4
(a) Amounts in derivatives are primarily included in Operating Revenues.
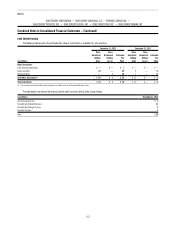
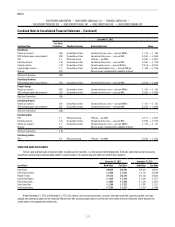
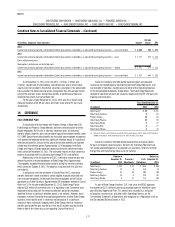
QUANTITATIVE INFORMATION ABOUT UNOBSERVABLE INPUTS
The following table provides quantitative information about the Duke Energy Registrants’ derivatives classified as Level 3.
December 31, 2013
Investment Type
Fair Value
(in millions) Valuation Technique Unobservable Input Range
Duke Energy
Natural gas contracts $ (2) Discounted cash flow Forward natural gas curves — price per MMBtu $ 3.07 —$ 5.37
FERC mitigation power sale agreements $ (2) Discounted cash flow Forward electricity curves — price per MWh $ 25.79 —$ 52.38
Financial transmission rights (FTRs) $ 12 RTO auction pricing FTR price — per Megawatt Hour (MWh) $ (0.30) —$ 13.80
Electricity contracts $ 23 Discounted cash flow Forward electricity curves — price per MWh $ 20.77 —$ 58.90
Commodity capacity option contracts $ 4 Discounted cash flow Forward capacity option curves — price per MW day $ 30.40 —$165.10
Reserves $(22) Bid-ask spreads, implied volatility, probability of default
Total Level 3 derivatives $ 13
Duke Energy Carolinas
FERC mitigation power sale agreements $ (2) Discounted cash flow Forward electricity curves — price per MWh $ 25.79 —$ 52.38
Duke Energy Ohio
Electricity contracts $ 18 Discounted cash flow Forward electricity curves — price per MWh $ 20.77 —$ 58.90
Natural gas contracts $ (2) Discounted cash flow Forward natural gas curves — price per MMBtu $ 3.07 —$ 5.37
Reserves $(20) Bid-ask spreads, implied volatility, probability of default
Total Level 3 derivatives $ (4)
Duke Energy Indiana
FTRs $ 12 RTO auction pricing FTR price — per MWh $ (0.30) —$ 13.80