Duke Energy 2013 Annual Report Download - page 194
Download and view the complete annual report
Please find page 194 of the 2013 Duke Energy annual report below. You can navigate through the pages in the report by either clicking on the pages listed below, or by using the keyword search tool below to find specific information within the annual report.-
 1
1 -
2
-
3
-
4
-
5
-
6
-
7
-
8
-
9
-
10
-
11
-
12
-
13
-
14
-
15
-
16
-
17
-
18
-
19
-
20
-
21
-
22
-
23
-
24
-
25
-
26
-
27
-
28
-
29
-
30
-
31
-
32
-
33
-
34
-
35
-
36
-
37
-
38
-
39
-
40
-
41
-
42
-
43
-
44
-
45
-
46
-
47
-
48
-
49
-
50
-
51
-
52
-
53
-
54
-
55
-
56
-
57
-
58
-
59
-
60
-
61
-
62
-
63
-
64
-
65
-
66
-
67
-
68
-
69
-
70
-
71
-
72
-
73
-
74
-
75
-
76
-
77
-
78
-
79
-
80
-
81
-
82
-
83
-
84
-
85
-
86
-
87
-
88
-
89
-
90
-
91
-
92
-
93
-
94
-
95
-
96
-
97
-
98
-
99
-
100
-
101
-
102
-
103
-
104
-
105
-
106
-
107
-
108
-
109
-
110
-
111
-
112
-
113
-
114
-
115
-
116
-
117
-
118
-
119
-
120
-
121
-
122
-
123
-
124
-
125
-
126
-
127
-
128
-
129
-
130
-
131
-
132
-
133
-
134
-
135
-
136
-
137
-
138
-
139
-
140
-
141
-
142
-
143
-
144
-
145
-
146
-
147
-
148
-
149
-
150
-
151
-
152
-
153
-
154
-
155
-
156
-
157
-
158
-
159
-
160
-
161
-
162
-
163
-
164
-
165
-
166
-
167
-
168
-
169
-
170
-
171
-
172
-
173
-
174
-
175
-
176
-
177
-
178
-
179
-
180
-
181
-
182
-
183
-
 184
184 -
 185
185 -
 186
186 -
 187
187 -
 188
188 -
 189
189 -
 190
190 -
 191
191 -
 192
192 -
 193
193 -
 194
194 -
 195
195 -
 196
196 -
 197
197 -
 198
198 -
 199
199 -
 200
200 -
 201
201 -
 202
202 -
 203
203 -
 204
204 -
205
-
206
-
207
-
208
-
209
-
210
-
211
-
212
-
213
-
214
-
215
-
216
-
217
-
218
-
219
-
220
-
221
-
222
-
223
-
224
-
225
-
226
-
227
-
228
-
229
-
230
-
231
-
232
-
233
-
234
-
235
-
236
-
237
-
238
-
239
-
240
-
241
-
242
-
243
-
244
-
245
-
246
-
247
-
248
-
249
-
250
-
251
-
252
-
253
-
254
-
255
-
256
-
257
-
258
-
259
 |
 |

176
PART II
DUKE ENERGY CORPORATION • DUKE ENERGY CAROLINAS, LLC • PROGRESS ENERGY, INC. •
DUKE ENERGY PROGRESS, INC. • DUKE ENERGY FLORIDA, INC. • DUKE ENERGY OHIO, INC. • DUKE ENERGY INDIANA, INC.
Combined Notes to Consolidated Financial Statements – (Continued)
on the notes since the allocated basis and the face value are nearly equivalent.
An impairment charge is recorded against the carrying value of both retained
interests and purchased beneficial interest whenever it is determined that an
other-than-temporary impairment has occurred.
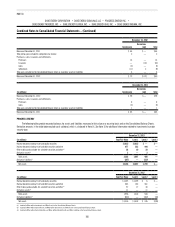
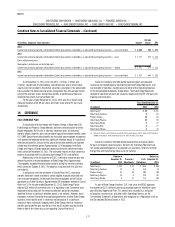
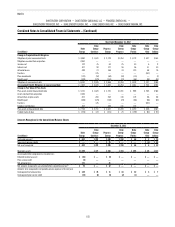
The following table shows the gross and net receivables sold.
Duke Energy Ohio Duke Energy Indiana
December 31, December 31,
(in millions) 2013 2012 2013 2012
Receivables sold $ 290 $ 282 $ 340 $ 289
Less: Retained interests 114 97 143 116
Net receivables sold $ 176 $ 185 $ 197 $ 173
Key assumptions used in estimating the fair value in 2013 and 2012 is detailed in the following table.
Duke Energy Ohio Duke Energy Indiana
2013 2012 2013 2012
Anticipated credit loss ratio 0.6 % 0.7 % 0.3 % 0.3 %
Discount rate 1.2 % 1.2 % 1.2 % 1.2 %
Receivable turnover rate 12.8 % 12.7 % 10.3 % 10.2 %
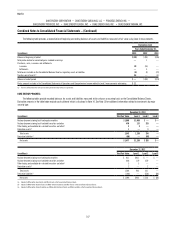
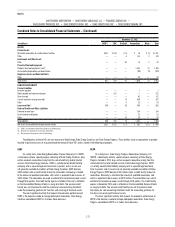
The following tables show sales and cash flows related to receivables sold.
Duke Energy Ohio Duke Energy Indiana
Years Ended December 31, Years Ended December 31,
(in millions) 2013 2012 2011 2013 2012 2011
Sales
Receivables sold $2,251 $2,154 $2,390 $2,985 $2,773 $ 2,658
Loss recognized on sale 12 13 21 11 12 16
Cash Flows
Cash proceeds from receivables sold 2,220 2,172 2,474 2,944 2,784 2,674
Collection fees received 1 1 1 1 1 1
Return received on retained interests 5 5 12 6 7 13
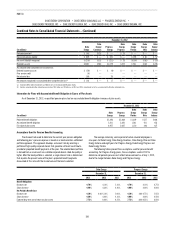
Cash flows from the sale of receivables are reflected within Operating
Activities on Duke Energy Ohio’s and Duke Energy Indiana’s Consolidated
Statements of Cash Flows.
Collection fees received in connection with the servicing of transferred
accounts receivable are included in Operation, maintenance and other on Duke
Energy Ohio’s and Duke Energy Indiana’s Consolidated Statements of Operations
and Comprehensive Income. The loss recognized on sales of receivables is
calculated monthly by multiplying the receivables sold during the month by the
required discount. The required discount is derived monthly utilizing a three-
year weighted-average formula that considers charge-off history, late charge
history, and turnover history on the sold receivables, as well as a component
for the time value of money. The discount rate, or component for the time value
of money, is calculated monthly by summing the prior month-end LIBOR plus a
fixed rate of 1.00 percent.
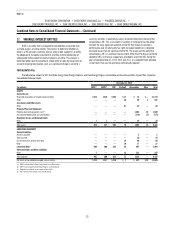
18. COMMON STOCK
Basic Earnings Per Share (EPS) is computed by dividing net income
attributable to Duke Energy common shareholders, adjusted for distributed
and undistributed earnings allocated to participating securities, by the
weighted-average number of common shares outstanding during the period.
Diluted EPS is computed by dividing net income attributable to Duke Energy
common shareholders, as adjusted for distributed and undistributed earnings
allocated to participating securities, by the diluted weighted-average number of
common shares outstanding during the period. Diluted EPS reflects the potential
dilution that could occur if securities or other agreements to issue common
stock, such as stock options, phantom shares and stock-based performance
unit awards were exercised or settled. Duke Energy’s participating securities
are restricted stock units that are entitled to dividends declared on Duke Energy
common shares during the restricted stock units’ vesting period.
On July 2, 2012, just prior to the close of the merger with Progress Energy,
Duke Energy executed a one-for-three reverse stock split. All earnings per share
amounts included in this 10-K are presented as if the one-for-three reverse
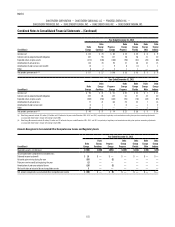
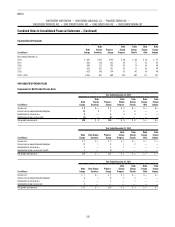
stock split had been effective January 1, 2011. The following table presents
Duke Energy’s basic and diluted EPS calculations and reconciles the weighted-
average number of common shares outstanding to the diluted weighted-average
number of common shares outstanding.