Duke Energy 2013 Annual Report Download - page 206
Download and view the complete annual report
Please find page 206 of the 2013 Duke Energy annual report below. You can navigate through the pages in the report by either clicking on the pages listed below, or by using the keyword search tool below to find specific information within the annual report.-
 1
1 -
2
-
3
-
4
-
5
-
6
-
7
-
8
-
9
-
10
-
11
-
12
-
13
-
14
-
15
-
16
-
17
-
18
-
19
-
20
-
21
-
22
-
23
-
24
-
25
-
26
-
27
-
28
-
29
-
30
-
31
-
32
-
33
-
34
-
35
-
36
-
37
-
38
-
39
-
40
-
41
-
42
-
43
-
44
-
45
-
46
-
47
-
48
-
49
-
50
-
51
-
52
-
53
-
54
-
55
-
56
-
57
-
58
-
59
-
60
-
61
-
62
-
63
-
64
-
65
-
66
-
67
-
68
-
69
-
70
-
71
-
72
-
73
-
74
-
75
-
76
-
77
-
78
-
79
-
80
-
81
-
82
-
83
-
84
-
85
-
86
-
87
-
88
-
89
-
90
-
91
-
92
-
93
-
94
-
95
-
96
-
97
-
98
-
99
-
100
-
101
-
102
-
103
-
104
-
105
-
106
-
107
-
108
-
109
-
110
-
111
-
112
-
113
-
114
-
115
-
116
-
117
-
118
-
119
-
120
-
121
-
122
-
123
-
124
-
125
-
126
-
127
-
128
-
129
-
130
-
131
-
132
-
133
-
134
-
135
-
136
-
137
-
138
-
139
-
140
-
141
-
142
-
143
-
144
-
145
-
146
-
147
-
148
-
149
-
150
-
151
-
152
-
153
-
154
-
155
-
156
-
157
-
158
-
159
-
160
-
161
-
162
-
163
-
164
-
165
-
166
-
167
-
168
-
169
-
170
-
171
-
172
-
173
-
174
-
175
-
176
-
177
-
178
-
179
-
180
-
181
-
182
-
183
-
184
-
185
-
186
-
187
-
188
-
189
-
190
-
191
-
192
-
193
-
194
-
195
-
 196
196 -
 197
197 -
 198
198 -
 199
199 -
 200
200 -
 201
201 -
 202
202 -
 203
203 -
 204
204 -
 205
205 -
 206
206 -
 207
207 -
 208
208 -
 209
209 -
 210
210 -
 211
211 -
 212
212 -
 213
213 -
 214
214 -
 215
215 -
 216
216 -
217
-
218
-
219
-
220
-
221
-
222
-
223
-
224
-
225
-
226
-
227
-
228
-
229
-
230
-
231
-
232
-
233
-
234
-
235
-
236
-
237
-
238
-
239
-
240
-
241
-
242
-
243
-
244
-
245
-
246
-
247
-
248
-
249
-
250
-
251
-
252
-
253
-
254
-
255
-
256
-
257
-
258
-
259
 |
 |

188
PART II
DUKE ENERGY CORPORATION • DUKE ENERGY CAROLINAS, LLC • PROGRESS ENERGY, INC. •
DUKE ENERGY PROGRESS, INC. • DUKE ENERGY FLORIDA, INC. • DUKE ENERGY OHIO, INC. • DUKE ENERGY INDIANA, INC.
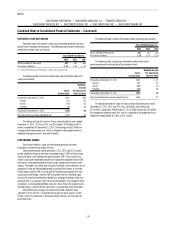
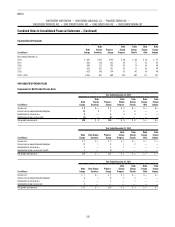
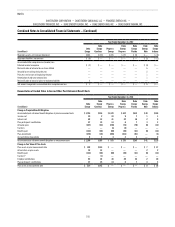
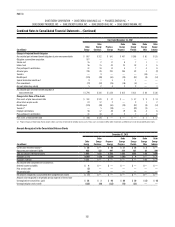
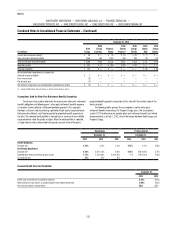
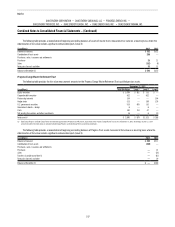
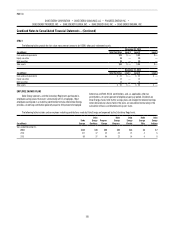
Combined Notes to Consolidated Financial Statements – (Continued)
December 31, 2012
(in millions)
Duke
Energy
Duke
Energy
Carolinas
Progress
Energy
Duke
Energy
Progress
Duke
Energy
Florida
Duke
Energy
Ohio
Duke
Energy
Indiana
Current pension liability(a) $ 30 $ 3 $ 11 $ 2 $ 3 $ — $—
Noncurrent pension liability 305 13 165 36 42 4 5
Total accrued pension liability $ 335 $ 16 $176 $ 38 $ 45 $ 4 $ 5
Regulatory assets $ 59 $ 3 $ 34 $ 7 $ 9 $ — $ 2
Regulatory liabilities $ 2 $ — $ — $— $ — $ — $—
Accumulated other comprehensive (income) loss
Deferred income tax asset $ — $ — $ (4) $— $ — $ — $ —
Net actuarial (gain) loss (1) — 12 — — — —
Net amounts recognized in accumulated other comprehensive (income) loss $ (1) $ — $ 8 $— $ — $ — $—
(a) Included in Other within Current Liabilities on the Consolidated Balance Sheets.
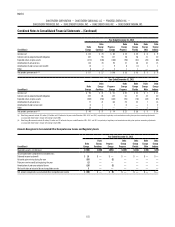
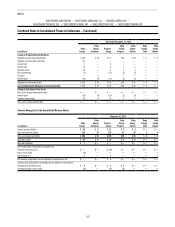
Information for Plans with Accumulated Benefit Obligation in Excess of Plan Assets
December 31, 2013
(in millions)
Duke
Energy
Duke
Energy
Carolinas
Progress
Energy
Duke
Energy
Progress
Duke
Energy
Florida
Duke
Energy
Ohio
Duke
Energy
Indiana
Projected benefit obligation $ 304 $ 15 $ 140 $ 34 $ 39 $ 3 $5
Accumulated benefit obligation 302 15 140 34 39 3 5
December 31, 2012
(in millions)
Duke
Energy
Duke
Energy
Carolinas
Progress
Energy
Duke
Energy
Progress
Duke
Energy
Florida
Duke
Energy
Ohio
Duke
Energy
Indiana
Projected benefit obligation $335 $16 $176 $38 $ 45 $ 4 $ 5
Accumulated benefit obligation 332 16 175 36 44 4 5
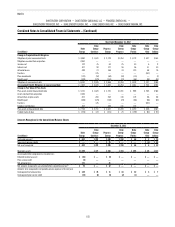
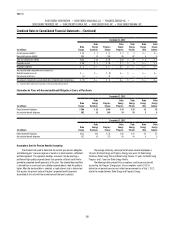
Assumptions Used for Pension Benefits Accounting
The discount rate used to determine the current year pension obligation
and following year’s pension expense is based on a bond selection-settlement
portfolio approach. This approach develops a discount rate by selecting a
portfolio of high quality corporate bonds that generate sufficient cash flow to
provide for projected benefit payments of the plan. The selected bond portfolio
is derived from a universe of non-callable corporate bonds rated Aa quality or
higher. After the bond portfolio is selected, a single interest rate is determined
that equates the present value of the plan’s projected benefit payments
discounted at this rate with the market value of the bonds selected.
The average remaining service period of active covered employees is
13 years for Duke Energy and Progress Energy, nine years for Duke Energy
Carolinas, Duke Energy Ohio and Duke Energy Indiana, 12 years for Duke Energy
Progress and 17 years for Duke Energy Florida.
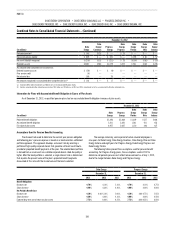
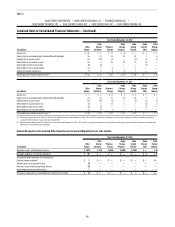
The following tables present the assumptions used for pension benefit
accounting. For Progress Energy plans, the assumptions used in 2012 to
determine net periodic pension cost reflect remeasurement as of July 1, 2012,
due to the merger between Duke Energy and Progress Energy.