Duke Energy 2013 Annual Report Download - page 195
Download and view the complete annual report
Please find page 195 of the 2013 Duke Energy annual report below. You can navigate through the pages in the report by either clicking on the pages listed below, or by using the keyword search tool below to find specific information within the annual report.
177
PART II
DUKE ENERGY CORPORATION • DUKE ENERGY CAROLINAS, LLC • PROGRESS ENERGY, INC. •
DUKE ENERGY PROGRESS, INC. • DUKE ENERGY FLORIDA, INC. • DUKE ENERGY OHIO, INC. • DUKE ENERGY INDIANA, INC.
Combined Notes to Consolidated Financial Statements – (Continued)
(In millions, except per-share amounts) Income
Average
Shares EPS
2013
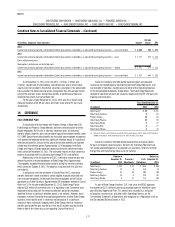
Income from continuing operations attributable to Duke Energy common shareholders, as adjusted for participating securities — basic and diluted $ 2,640 706 $ 3.74
2012
Income from continuing operations attributable to Duke Energy common shareholders, as adjusted for participating securities — basic $ 1,727 574 $ 3.01
Effect of dilutive securities:
Stock options, performance and restricted stock 1
Income from continuing operations attributable to Duke Energy common shareholders, as adjusted for participating securities — diluted $ 1,727 575 $ 3.01
2011
Income from continuing operations attributable to Duke Energy common shareholders, as adjusted for participating securities — basic and diluted $ 1,702 444 $ 3.83
As of December 31, 2013, 2012 and 2011, 2 million, 1 million and
3 million, respectively, of stock options and performance and unvested stock
awards were not included in the dilutive securities calculation in the above table
because either the option exercise prices were greater than the average market
price of the common shares during those periods, or performance measures
related to the awards had not yet been met.
For the years ended December 31, 2013, 2012 and 2011, Duke Energy
declared dividends of $3.09 per share, $3.03 per share and $2.97 per share,
respectively.
19. SEVERANCE
2011 SEVERANCE PLAN
In conjunction with the merger with Progress Energy, in November 2011
Duke Energy and Progress Energy offered a voluntary severance plan to certain
eligible employees. As this was a voluntary severance plan, all severance
benefits offered under this plan are considered special termination benefits under
U.S. GAAP. Special termination benefits are measured upon employee acceptance
and recorded immediately absent any significant retention period. If a significant
retention period exists, the cost of the special termination benefits are recorded
ratably over the retention period. Approximately 1,100 employees from Duke
Energy and Progress Energy requested severance during the voluntary window,
which closed on November 30, 2011. The estimated amount of future severance
expense associated with this voluntary plan through 2014 is not material.
Additionally, in the third quarter of 2012, a voluntary severance plan was
offered to certain unionized employees of Duke Energy Ohio. Approximately
75 employees accepted the termination benefits during the voluntary window,
which closed on October 8, 2012. The expense associated with this plan was
not material.
In conjunction with the retirement of Crystal River Unit 3, severance
benefits have been made available to certain eligible impacted unionized and
non-unionized employees, to the extent that those employees do not find job
opportunities at other locations. Approximately 600 employees worked at Crystal
River Unit 3. For the year ended December 31, 2013, Duke Energy Florida
deferred $26 million of severance costs as a regulatory asset. Severance costs
expected to be accrued over the remaining retention period for employees
identified to have a significant retention period is not material. However, these
employees maintain the ability to accept job opportunities at other Duke Energy
locations, which would result in severance not being paid. If a significant
amount of these individuals redeploy within Duke Energy, the final severance
benefits paid under the plan may be less than what has been accrued to date.
Refer to Note 4 for further discussion regarding Crystal River Unit 3.
Amounts included in the table below represent direct and allocated
severance and related expense recorded by the Duke Energy Registrants, and
are recorded in Operation, maintenance and other within Operating Expenses
on the Consolidated Statements of Operations. The Duke Energy Registrants
recorded insignificant amounts for severance expense during 2011 for past and
ongoing severance plans.
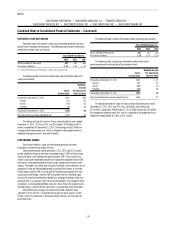
Years Ended December 31,
(in millions) 2013 2012
Duke Energy(a) $ 34 $ 201
Duke Energy Carolinas 8 63
Progress Energy 19 82
Duke Energy Progress 14 55
Duke Energy Florida 5 27
Duke Energy Ohio 2 21
Duke Energy Indiana 2 18
(a) Includes $5 million and $14 million of accelerated stock award expense and $2 million and $19 million of
COBRA and healthcare reimbursement expenses for 2013 and 2012, respectively.
Amounts included in the table below represent the severance liability
for past and ongoing severance plans. Amounts for Subsidiary Registrants do
not include allocated expense or associated cash payments. Amounts for Duke
Energy Ohio and Duke Energy Indiana are not material.
(in millions)
Balance at
December 31,
2012
Provision /
Adjustments
Cash
Reductions
Balance at
December 31,
2013
Duke Energy $ 135 $ 52 $ (123) $ 64
Duke Energy Carolinas 12 6 (13) 5
Progress Energy 43 49 (48) 44
Duke Energy Progress 23 8 (20) 11
Duke Energy Florida 6 31 (13) 24
As part of Duke Energy Carolinas’ 2011 rate case, the NCUC approved
the recovery of $101 million of previously recorded expenses related to a prior
year Voluntary Opportunity Plan. This amount was recorded as a reduction
to Operation, maintenance, and other within Operating Expenses on the
Consolidated Statements of Operations and recognized as a Regulatory asset on
the Consolidated Balance Sheets in 2012.


