Duke Energy 2013 Annual Report Download - page 160
Download and view the complete annual report
Please find page 160 of the 2013 Duke Energy annual report below. You can navigate through the pages in the report by either clicking on the pages listed below, or by using the keyword search tool below to find specific information within the annual report.-
 1
1 -
2
-
3
-
4
-
5
-
6
-
7
-
8
-
9
-
10
-
11
-
12
-
13
-
14
-
15
-
16
-
17
-
18
-
19
-
20
-
21
-
22
-
23
-
24
-
25
-
26
-
27
-
28
-
29
-
30
-
31
-
32
-
33
-
34
-
35
-
36
-
37
-
38
-
39
-
40
-
41
-
42
-
43
-
44
-
45
-
46
-
47
-
48
-
49
-
50
-
51
-
52
-
53
-
54
-
55
-
56
-
57
-
58
-
59
-
60
-
61
-
62
-
63
-
64
-
65
-
66
-
67
-
68
-
69
-
70
-
71
-
72
-
73
-
74
-
75
-
76
-
77
-
78
-
79
-
80
-
81
-
82
-
83
-
84
-
85
-
86
-
87
-
88
-
89
-
90
-
91
-
92
-
93
-
94
-
95
-
96
-
97
-
98
-
99
-
100
-
101
-
102
-
103
-
104
-
105
-
106
-
107
-
108
-
109
-
110
-
111
-
112
-
113
-
114
-
115
-
116
-
117
-
118
-
119
-
120
-
121
-
122
-
123
-
124
-
125
-
126
-
127
-
128
-
129
-
130
-
131
-
132
-
133
-
134
-
135
-
136
-
137
-
138
-
139
-
140
-
141
-
142
-
143
-
144
-
145
-
146
-
147
-
148
-
149
-
 150
150 -
 151
151 -
 152
152 -
 153
153 -
 154
154 -
 155
155 -
 156
156 -
 157
157 -
 158
158 -
 159
159 -
 160
160 -
 161
161 -
 162
162 -
 163
163 -
 164
164 -
 165
165 -
 166
166 -
 167
167 -
 168
168 -
 169
169 -
 170
170 -
171
-
172
-
173
-
174
-
175
-
176
-
177
-
178
-
179
-
180
-
181
-
182
-
183
-
184
-
185
-
186
-
187
-
188
-
189
-
190
-
191
-
192
-
193
-
194
-
195
-
196
-
197
-
198
-
199
-
200
-
201
-
202
-
203
-
204
-
205
-
206
-
207
-
208
-
209
-
210
-
211
-
212
-
213
-
214
-
215
-
216
-
217
-
218
-
219
-
220
-
221
-
222
-
223
-
224
-
225
-
226
-
227
-
228
-
229
-
230
-
231
-
232
-
233
-
234
-
235
-
236
-
237
-
238
-
239
-
240
-
241
-
242
-
243
-
244
-
245
-
246
-
247
-
248
-
249
-
250
-
251
-
252
-
253
-
254
-
255
-
256
-
257
-
258
-
259
 |
 |

142
PART II
DUKE ENERGY CORPORATION • DUKE ENERGY CAROLINAS, LLC • PROGRESS ENERGY, INC. •
DUKE ENERGY PROGRESS, INC. • DUKE ENERGY FLORIDA, INC. • DUKE ENERGY OHIO, INC. • DUKE ENERGY INDIANA, INC.
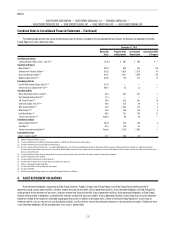
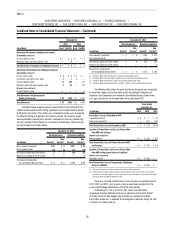
Combined Notes to Consolidated Financial Statements – (Continued)
December 31, 2012
(in millions)
Duke
Energy
Duke
Energy
Carolinas
Progress
Energy
Duke
Energy
Progress
Duke
Energy
Florida
Duke
Energy
Ohio
Duke
Energy
Indiana
Emission allowances $ 80 $— $ 26 $ 4 $ 22 $ 24 $ 29
Renewable energy certificates 18 14 2 1 — — —
Gas, coal and power contracts 295 — — — — 272 24
Wind development rights 111 — — — — — —
Other 91 — — — — 10 —
Total gross carrying amounts 595 14 28 5 22 306 53
Accumulated amortization — gas, coal and power contracts (180) — — — — (168) (12)
Accumulated amortization — wind development rights (9) — — — — — —
Accumulated amortization — other (34) — — — — (9) —
Total accumulated amortization (223) — — — — (177) (12)
Total intangible assets, net $ 372 $ 14 $ 28 $ 5 $ 22 $ 129 $ 41
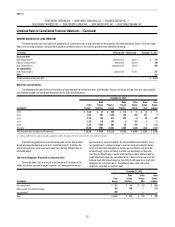
Impairment of Emission Allowances
On August 8, 2011, the EPA’s final rule to replace CAIR was published in
the Federal Register. As further discussed in Note 5, CSAPR established state-
level annual SO2 and NOx caps that were required to take effect on January 1,
2012, and state-level ozone-season NOx caps that were to take effect on
May 1, 2012. CSAPR did not utilize CAA emission allowances as the original
CAIR provided. Under CSAPR, the EPA was expected to issue new emission
allowances to be used exclusively for purposes of complying with CSAPR
cap-and-trade program. After this ruling was published in 2011, Duke Energy
evaluated the effect of CSAPR on the carrying value of emission allowances
recorded at its Regulated Utilities and Commercial Power segments. Based on
the provisions of CSAPR, Duke Energy Ohio had more SO2 allowances than were
needed to comply with the continuing CAA acid rain cap-and-trade program
(excess emission allowances). Duke Energy Ohio incurred a pretax impairment
of $79 million in 2011 to write down the carrying value of excess emission
allowances held by Commercial Power to fair value. The charge is recorded in
Goodwill and other impairment charges on Duke Energy Ohio’s Consolidated
Statements of Operations. This amount was based on the fair value of excess
allowances held by Commercial Power for compliance under the continuing CAA
acid rain cap-and-trade program as of September 30, 2011.
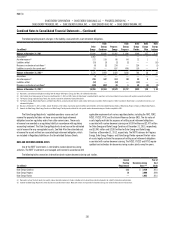
Amortization Expense
The following table presents amortization expense for gas, coal and power
contracts, wind development rights and other intangible assets.
December 31,
(in millions) 2013 2012 2011
Duke Energy $13 $14 $ 10
Duke Energy Ohio 8 12 8
Duke Energy Indiana 1 1 1
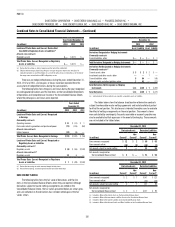
The table below shows the expected amortization expense for the
next five years for intangible assets as of December 31, 2013. The expected
amortization expense includes estimates of emission allowances consumption
and estimates of consumption of commodities such as gas and coal under
existing contracts, as well as estimated amortization related to the wind
development projects. The amortization amounts discussed below are estimates
and actual amounts may differ from these estimates due to such factors as
changes in consumption patterns, sales or impairments of emission allowances
or other intangible assets, delays in the in-service dates of wind assets,
additional intangible acquisitions and other events.
(in millions) 2014 2015 2016 2017 2018
Duke Energy $43 $ 19 $ 17 $ 16 $ 16
Progress Energy 4 3 2 1 1
Duke Energy Progress 1 — — — —
Duke Energy Florida 3 3 2 1 1
Duke Energy Ohio 11 9 9 9 9
Duke Energy Indiana 22 1 1 1 1
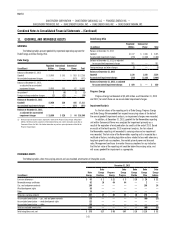
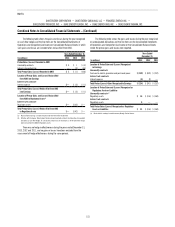
12. INVESTMENTS IN UNCONSOLIDATED AFFILIATES
EQUITY METHOD INVESTMENTS
Investments in domestic and international affiliates that are not controlled
by Duke Energy, but over which it has significant influence, are accounted for
using the equity method. As of December 31, 2013 and 2012, the carrying
amount of investments in affiliates with carrying amounts greater than zero
approximated the amount of underlying equity in net assets.