Duke Energy 2013 Annual Report Download - page 200
Download and view the complete annual report
Please find page 200 of the 2013 Duke Energy annual report below. You can navigate through the pages in the report by either clicking on the pages listed below, or by using the keyword search tool below to find specific information within the annual report.-
 1
1 -
2
-
3
-
4
-
5
-
6
-
7
-
8
-
9
-
10
-
11
-
12
-
13
-
14
-
15
-
16
-
17
-
18
-
19
-
20
-
21
-
22
-
23
-
24
-
25
-
26
-
27
-
28
-
29
-
30
-
31
-
32
-
33
-
34
-
35
-
36
-
37
-
38
-
39
-
40
-
41
-
42
-
43
-
44
-
45
-
46
-
47
-
48
-
49
-
50
-
51
-
52
-
53
-
54
-
55
-
56
-
57
-
58
-
59
-
60
-
61
-
62
-
63
-
64
-
65
-
66
-
67
-
68
-
69
-
70
-
71
-
72
-
73
-
74
-
75
-
76
-
77
-
78
-
79
-
80
-
81
-
82
-
83
-
84
-
85
-
86
-
87
-
88
-
89
-
90
-
91
-
92
-
93
-
94
-
95
-
96
-
97
-
98
-
99
-
100
-
101
-
102
-
103
-
104
-
105
-
106
-
107
-
108
-
109
-
110
-
111
-
112
-
113
-
114
-
115
-
116
-
117
-
118
-
119
-
120
-
121
-
122
-
123
-
124
-
125
-
126
-
127
-
128
-
129
-
130
-
131
-
132
-
133
-
134
-
135
-
136
-
137
-
138
-
139
-
140
-
141
-
142
-
143
-
144
-
145
-
146
-
147
-
148
-
149
-
150
-
151
-
152
-
153
-
154
-
155
-
156
-
157
-
158
-
159
-
160
-
161
-
162
-
163
-
164
-
165
-
166
-
167
-
168
-
169
-
170
-
171
-
172
-
173
-
174
-
175
-
176
-
177
-
178
-
179
-
180
-
181
-
182
-
183
-
184
-
185
-
186
-
187
-
188
-
189
-
 190
190 -
 191
191 -
 192
192 -
 193
193 -
 194
194 -
 195
195 -
 196
196 -
 197
197 -
 198
198 -
 199
199 -
 200
200 -
 201
201 -
 202
202 -
 203
203 -
 204
204 -
 205
205 -
 206
206 -
 207
207 -
 208
208 -
 209
209 -
 210
210 -
211
-
212
-
213
-
214
-
215
-
216
-
217
-
218
-
219
-
220
-
221
-
222
-
223
-
224
-
225
-
226
-
227
-
228
-
229
-
230
-
231
-
232
-
233
-
234
-
235
-
236
-
237
-
238
-
239
-
240
-
241
-
242
-
243
-
244
-
245
-
246
-
247
-
248
-
249
-
250
-
251
-
252
-
253
-
254
-
255
-
256
-
257
-
258
-
259
 |
 |

182
PART II
DUKE ENERGY CORPORATION • DUKE ENERGY CAROLINAS, LLC • PROGRESS ENERGY, INC. •
DUKE ENERGY PROGRESS, INC. • DUKE ENERGY FLORIDA, INC. • DUKE ENERGY OHIO, INC. • DUKE ENERGY INDIANA, INC.
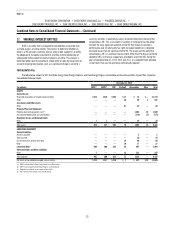
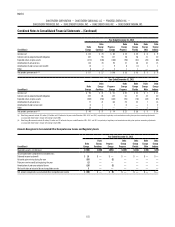
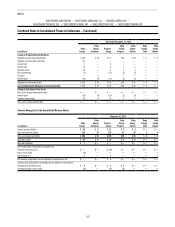
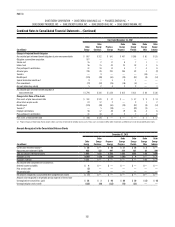
Combined Notes to Consolidated Financial Statements – (Continued)
Year Ended December 31, 2012
(in millions)
Duke
Energy
Duke
Energy
Carolinas
Progress
Energy
Duke
Energy
Progress
Duke
Energy
Florida
Duke
Energy
Ohio
Duke
Energy
Indiana
Regulatory assets, net increase (decrease) $976 $(111) $(76) $(89) $ 23 $ 22 $ 17
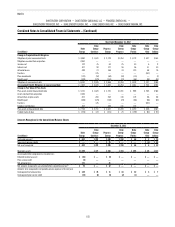
Accumulated other comprehensive (income) loss
Deferred income tax benefit $ 14 $ — $ — $ — $— $ 15 $—
Reclassification of actuarial losses to an affiliate — — — — — (48) —
Actuarial (gains) losses arising during the year (2) — 3 — — — —
Prior year service credit arising during the year (7) — — — — — —
Amortization of prior year actuarial losses (13) — (2) — — (3) —
Reclassification of actuarial losses to regulatory assets (20) — — — — (1) —
Amortization of prior year service cost (1) — (1) — — (1) —
Net amount recognized in accumulated other comprehensive income $ (29) $ — $ — $ — $— $(38) $—
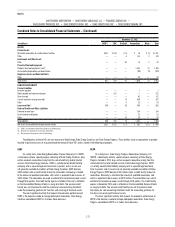
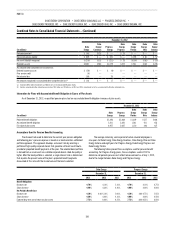
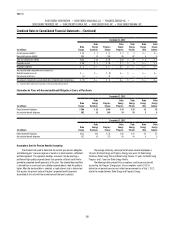
Reconciliation of Funded Status to Net Amount Recognized
Year Ended December 31, 2013
(in millions)
Duke
Energy
Duke
Energy
Carolinas
Progress
Energy
Duke
Energy
Progress
Duke
Energy
Florida
Duke
Energy
Ohio
Duke
Energy
Indiana
Change in Projected Benefit Obligation
Obligation at prior measurement date $ 8,030 $2,028 $2,868 $1,264 $1,309 $ 527 $ 684
Service cost 167 49 60 22 30 6 11
Interest cost 320 80 116 50 53 21 28
Actuarial gains (399) (73) (118) (26) (75) (71) (56)
Transfers — (26) (7) (45) (17) (2) (2)
Plan amendments (41) (13) (19) (8) (7) — —
Benefits paid (567) (170) (161) (85) (60) (39) (33)
Obligation at measurement date $ 7,510 $1,875 $2,739 $1,172 $1,233 $ 442 $ 632
Accumulated Benefit Obligation at measurement date $ 7,361 $1,875 $2,698 $1,172 $1,192 $ 429 $ 608
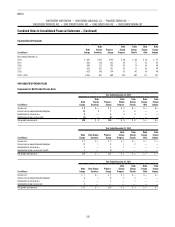
Change in Fair Value of Plan Assets
Plan assets at prior measurement date $ 7,754 $2,151 $2,647 $1,289 $1,150 $ 446 $ 627
Actual return on plan assets 705 207 215 108 93 43 62
Benefits paid (567) (170) (161) (85) (60) (39) (33)
Transfers — (26) (7) (45) (17) (2) (2)
Employer contributions 250 — 250 63 133 — —
Plan assets at measurement date $ 8,142 $2,162 $2,944 $1,330 $1,299 $ 448 $ 654
Funded status of plan $ 632 $ 287 $ 205 $ 158 $ 66 $ 6 $ 22