Duke Energy 2013 Annual Report Download - page 61
Download and view the complete annual report
Please find page 61 of the 2013 Duke Energy annual report below. You can navigate through the pages in the report by either clicking on the pages listed below, or by using the keyword search tool below to find specific information within the annual report.-
 1
1 -
2
-
3
-
4
-
5
-
6
-
7
-
8
-
9
-
10
-
11
-
12
-
13
-
14
-
15
-
16
-
17
-
18
-
19
-
20
-
21
-
22
-
23
-
24
-
25
-
26
-
27
-
28
-
29
-
30
-
31
-
32
-
33
-
34
-
35
-
36
-
37
-
38
-
39
-
40
-
41
-
42
-
43
-
44
-
45
-
46
-
47
-
48
-
49
-
50
-
 51
51 -
 52
52 -
 53
53 -
 54
54 -
 55
55 -
 56
56 -
 57
57 -
 58
58 -
 59
59 -
 60
60 -
 61
61 -
 62
62 -
 63
63 -
 64
64 -
 65
65 -
 66
66 -
 67
67 -
 68
68 -
 69
69 -
 70
70 -
 71
71 -
72
-
73
-
74
-
75
-
76
-
77
-
78
-
79
-
80
-
81
-
82
-
83
-
84
-
85
-
86
-
87
-
88
-
89
-
90
-
91
-
92
-
93
-
94
-
95
-
96
-
97
-
98
-
99
-
100
-
101
-
102
-
103
-
104
-
105
-
106
-
107
-
108
-
109
-
110
-
111
-
112
-
113
-
114
-
115
-
116
-
117
-
118
-
119
-
120
-
121
-
122
-
123
-
124
-
125
-
126
-
127
-
128
-
129
-
130
-
131
-
132
-
133
-
134
-
135
-
136
-
137
-
138
-
139
-
140
-
141
-
142
-
143
-
144
-
145
-
146
-
147
-
148
-
149
-
150
-
151
-
152
-
153
-
154
-
155
-
156
-
157
-
158
-
159
-
160
-
161
-
162
-
163
-
164
-
165
-
166
-
167
-
168
-
169
-
170
-
171
-
172
-
173
-
174
-
175
-
176
-
177
-
178
-
179
-
180
-
181
-
182
-
183
-
184
-
185
-
186
-
187
-
188
-
189
-
190
-
191
-
192
-
193
-
194
-
195
-
196
-
197
-
198
-
199
-
200
-
201
-
202
-
203
-
204
-
205
-
206
-
207
-
208
-
209
-
210
-
211
-
212
-
213
-
214
-
215
-
216
-
217
-
218
-
219
-
220
-
221
-
222
-
223
-
224
-
225
-
226
-
227
-
228
-
229
-
230
-
231
-
232
-
233
-
234
-
235
-
236
-
237
-
238
-
239
-
240
-
241
-
242
-
243
-
244
-
245
-
246
-
247
-
248
-
249
-
250
-
251
-
252
-
253
-
254
-
255
-
256
-
257
-
258
-
259
 |
 |

43
PART II
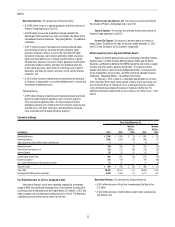
Other Income and Expense, net. The variance was primarily due to
lower AFUDC equity due primarily to the retirement of Crystal River Unit 3.
Interest Expense. The variance was primarily due to the deferral of debt
costs recorded on the retail portion of the retired Crystal River Unit 3 regulatory
asset beginning January 1, 2013.
Income Tax Expense. The variance was primarily due to an increase in
pretax income. The effective tax rates for the years ended December 31, 2013
and 2012 were 39.6 percent and 35.7 percent, respectively. The increase in the
effective tax rate was primarily due to the impact of lower AFUDC equity and
lower impairment charges.
DUKE ENERGY OHIO
Introduction
Management’s Discussion and Analysis should be read in conjunction with
the accompanying Consolidated Financial Statements and Notes for the years
ended December 31, 2013, 2012, and 2011.
Basis of Presentation
The results of operations and variance discussion for Duke Energy Ohio is
presented in a reduced disclosure format in accordance with General Instruction
(I)(2)(a) of Form 10-K.
Results of Operations
Years Ended December 31,
(in millions) 2013 2012 Variance
Operating Revenues $3,245 $3,152 $ 93
Operating Expenses 2,999 2,810 189
Gains on Sales of Other Assets and Other, net 57 (2)
Operating Income 251 349 (98)
Other Income and Expense, net 413 (9)
Interest Expense 78 89 (11)
Income Before Income Taxes 177 273 (96)
Income Tax Expense 75 98 (23)
Net Income $ 102 $ 175 $ (73)
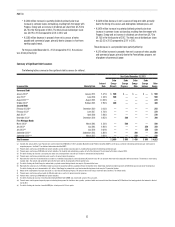
The following table shows the percent changes in Regulated Utilities’ GWh sales and average number of customers for Duke Energy Ohio. The below percentages
for retail customer classes represent billed sales only. Total sales includes billed and unbilled retail sales, and wholesale sales to incorporated municipalities and to
public and private utilities and power marketers. Amounts are not weather normalized.
Increase (decrease) over prior year 2013 2012
Residential sales 1.5 % (3.3)%
General service sales 0.8 % (2.6)%
Industrial sales 0.2 % 0.6%
Wholesale power sales 20.9 % (35.9)%
Total sales 0.9 % (2.3)%
Average number of customers 0.4 % 0.5%
Year Ended December 31, 2013 as Compared to 2012
Operating Revenues. The variance was primarily driven by:
• A $68 million increase in net mark-to-market revenue on non-qualifying
power and capacity hedge contracts, consisting of mark-to-market gains
of $70 million in 2013 compared to losses of $2 million in 2012;
• A $68 million increase for the gas-fired generation assets driven
primarily by higher power prices, partially offset by decreased volumes;
• A $41 million increase in rate riders and retail pricing primarily due to
rate increases in 2013;
• A $21 million increase for the coal-fired generation assets driven
primarily by increased volumes, partially offset by lower realized power
prices, including the impact of hedge settlements; and
• A $13 million increase related to favorable weather conditions.
Partially offset by:
• An $85 million decrease in PJM capacity revenue related to lower
average cleared capacity auction pricing; and
• A $41 million decrease in regulated fuel revenues primarily driven by
reduced sales volumes, partially offset by higher fuel costs.
Operating Expenses. The variance was primarily driven by:
• A $109 million increase in fuel expense for the gas-fired generation
assets driven by higher natural gas costs, partially offset by decreased
natural gas volumes;
• A $96 million increase in net mark-to-market fuel expense on non-
qualifying fuel hedge contracts, consisting of mark-to-market losses of
$99 million in 2013 compared to losses of $3 million in 2012; and
• A $41 million increase in property and other taxes driven primarily by an
Ohio property tax settlement recorded in 2012.