Duke Energy 2013 Annual Report Download - page 49
Download and view the complete annual report
Please find page 49 of the 2013 Duke Energy annual report below. You can navigate through the pages in the report by either clicking on the pages listed below, or by using the keyword search tool below to find specific information within the annual report.-
 1
1 -
2
-
3
-
4
-
5
-
6
-
7
-
8
-
9
-
10
-
11
-
12
-
13
-
14
-
15
-
16
-
17
-
18
-
19
-
20
-
21
-
22
-
23
-
24
-
25
-
26
-
27
-
28
-
29
-
30
-
31
-
32
-
33
-
34
-
35
-
36
-
37
-
38
-
 39
39 -
 40
40 -
 41
41 -
 42
42 -
 43
43 -
 44
44 -
 45
45 -
 46
46 -
 47
47 -
 48
48 -
 49
49 -
 50
50 -
 51
51 -
 52
52 -
 53
53 -
 54
54 -
 55
55 -
 56
56 -
 57
57 -
 58
58 -
 59
59 -
60
-
61
-
62
-
63
-
64
-
65
-
66
-
67
-
68
-
69
-
70
-
71
-
72
-
73
-
74
-
75
-
76
-
77
-
78
-
79
-
80
-
81
-
82
-
83
-
84
-
85
-
86
-
87
-
88
-
89
-
90
-
91
-
92
-
93
-
94
-
95
-
96
-
97
-
98
-
99
-
100
-
101
-
102
-
103
-
104
-
105
-
106
-
107
-
108
-
109
-
110
-
111
-
112
-
113
-
114
-
115
-
116
-
117
-
118
-
119
-
120
-
121
-
122
-
123
-
124
-
125
-
126
-
127
-
128
-
129
-
130
-
131
-
132
-
133
-
134
-
135
-
136
-
137
-
138
-
139
-
140
-
141
-
142
-
143
-
144
-
145
-
146
-
147
-
148
-
149
-
150
-
151
-
152
-
153
-
154
-
155
-
156
-
157
-
158
-
159
-
160
-
161
-
162
-
163
-
164
-
165
-
166
-
167
-
168
-
169
-
170
-
171
-
172
-
173
-
174
-
175
-
176
-
177
-
178
-
179
-
180
-
181
-
182
-
183
-
184
-
185
-
186
-
187
-
188
-
189
-
190
-
191
-
192
-
193
-
194
-
195
-
196
-
197
-
198
-
199
-
200
-
201
-
202
-
203
-
204
-
205
-
206
-
207
-
208
-
209
-
210
-
211
-
212
-
213
-
214
-
215
-
216
-
217
-
218
-
219
-
220
-
221
-
222
-
223
-
224
-
225
-
226
-
227
-
228
-
229
-
230
-
231
-
232
-
233
-
234
-
235
-
236
-
237
-
238
-
239
-
240
-
241
-
242
-
243
-
244
-
245
-
246
-
247
-
248
-
249
-
250
-
251
-
252
-
253
-
254
-
255
-
256
-
257
-
258
-
259
 |
 |

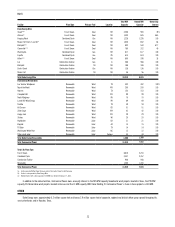
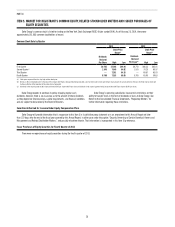
31
PART II
Year Ended December 31, 2011
(in millions, except per share amounts)
Regulated
Utilities
International
Energy
Commercial
Power
Total
Reportable
Segments Other
Duke
Energy
Per
Diluted
Share
Adjusted segment income $ 1,316 $ 466 $186 $ 1,968 $ (25) $1,943 $ 4.38
Edwardsport impairment and other charges (135) — — (135) — (135) (0.30)
Emission allowance impairment — — (51) (51) — (51) (0.12)
Costs to achieve Progress Energy merger — — — — (51) (51) (0.12)
Economic hedges (Mark-to-market) — — (1) (1) — (1) (0.01)
Segment income $ 1,181 $ 466 $134 $ 1,781 $ (76) 1,705
Income from Discontinued Operations 1 —
Net Income Attributable to Duke Energy $1,706 $ 3.83
The variance in adjusted earnings for the year ended December 31, 2013,
compared to 2012, was primarily due to:
• The inclusion of Progress Energy results for the first six months of 2013;
• Increased retail pricing and riders resulting primarily from the
implementation of revised rates in all jurisdictions; and
• Lower operating and maintenance expense resulting primarily from
the adoption of nuclear outage cost levelization in the Carolinas, lower
benefit costs and merger synergies.
Partially offsetting these increases were:
• Higher depreciation and amortization expense;
• Lower AFUDC;
• Lower nonregulated Midwest gas generation results; and
• Incremental shares issued to complete the Progress Energy merger
(impacts per diluted share amounts only).
The variance in adjusted earnings for the year ended December 31, 2012,
compared to 2011, was primarily due to:
• The inclusion of Progress Energy results beginning in July 2012; and
• Increased retail pricing and riders primarily resulting from the
implementation of revised rates in North Carolina and South Carolina
for Duke Energy Carolinas.
Partially offsetting these increases was:
• Unfavorable weather in 2012 compared to 2011;
• Higher depreciation and amortization expense;
• Lower nonregulated Midwest coal generation results; and
• Incremental shares issued to complete the Progress Energy merger
(impacts per diluted share amounts only).
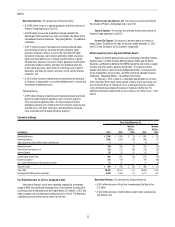
SEGMENT RESULTS
The remaining information presented in this discussion of results of
operations is on a GAAP basis.
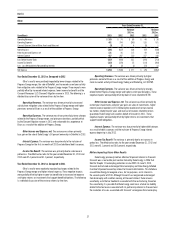
Regulated Utilities
Years Ended December 31,
(in millions) 2013 2012
Variance
2013 vs.
2012 2011
Variance
2012 vs.
2011
Operating Revenues $ 20,910 $ 16,080 $ 4,830 $ 10,619 $ 5,461
Operating Expenses 16,126 12,943 3,183 8,473 4,470
Gains on Sales of Other Assets and Other, net 7 15 (8) 2 13
Operating Income 4,791 3,152 1,639 2,148 1,004
Other Income and Expense, net 221 341 (120) 274 67
Interest Expense 986 806 180 568 238
Income Before Income Taxes 4,026 2,687 1,339 1,854 833
Income Tax Expense 1,522 941 581 673 268
Less: Income Attributable to Noncontrolling Interest — 2 (2) — 2
Segment Income $ 2,504 $ 1,744 $ 760 $ 1,181 $ 563
Duke Energy Carolinas’ GWh sales(a) 85,790 81,362 4,428 82,127 (765)
Duke Energy Progress’ GWh sales(b)(c) 60,204 58,390 1,814 56,223 2,167
Duke Energy Florida GWh sales(d) 37,974 38,443 (469) 39,578 (1,135)
Duke Energy Ohio GWh sales 24,557 24,344 213 24,923 (579)
Duke Energy Indiana GWh sales 33,715 33,577 138 33,181 396
Total Regulated Utilities GWh sales 242,240 236,116 6,124 236,032 84
Net proportional MW capacity in operation 49,607 49,654 (47) 27,397 22,257
(a) Includes 781 and 421 gigawatt-hour (GWh) sales for the years ended December 31, 2013 and 2012, respectively, associated with interim firm power sale agreements (Interim FERC Mitigation) entered into as part of FERC’s
approval of the merger with Progress Energy. The impacts of the Interim FERC Mitigation are reflected in the Other segment, and are not included in the operating results in the table above.
(b) Includes 904 and 577 GWh sales for the years ended December 31, 2013 and 2012, respectively, associated with the Interim FERC Mitigation. The impacts of the Interim FERC Mitigation are reflected in the Other segment,
and are not included in the operating results in the table above.
(c) For Duke Energy Progress, all GWh sales for the year ended December 31, 2011, and 26,634 GWh sales for the year ended December 31, 2012, occurred prior to the merger between Duke Energy and Progress Energy.
(d) For Duke Energy Florida, all GWh sales for the year ended December 31, 2011, and 18,348 GWh sales for the year ended December 31, 2012, occurred prior to the merger between Duke Energy and Progress Energy.