Duke Energy 2013 Annual Report Download - page 53
Download and view the complete annual report
Please find page 53 of the 2013 Duke Energy annual report below. You can navigate through the pages in the report by either clicking on the pages listed below, or by using the keyword search tool below to find specific information within the annual report.-
 1
1 -
2
-
3
-
4
-
5
-
6
-
7
-
8
-
9
-
10
-
11
-
12
-
13
-
14
-
15
-
16
-
17
-
18
-
19
-
20
-
21
-
22
-
23
-
24
-
25
-
26
-
27
-
28
-
29
-
30
-
31
-
32
-
33
-
34
-
35
-
36
-
37
-
38
-
39
-
40
-
41
-
42
-
 43
43 -
 44
44 -
 45
45 -
 46
46 -
 47
47 -
 48
48 -
 49
49 -
 50
50 -
 51
51 -
 52
52 -
 53
53 -
 54
54 -
 55
55 -
 56
56 -
 57
57 -
 58
58 -
 59
59 -
 60
60 -
 61
61 -
 62
62 -
 63
63 -
64
-
65
-
66
-
67
-
68
-
69
-
70
-
71
-
72
-
73
-
74
-
75
-
76
-
77
-
78
-
79
-
80
-
81
-
82
-
83
-
84
-
85
-
86
-
87
-
88
-
89
-
90
-
91
-
92
-
93
-
94
-
95
-
96
-
97
-
98
-
99
-
100
-
101
-
102
-
103
-
104
-
105
-
106
-
107
-
108
-
109
-
110
-
111
-
112
-
113
-
114
-
115
-
116
-
117
-
118
-
119
-
120
-
121
-
122
-
123
-
124
-
125
-
126
-
127
-
128
-
129
-
130
-
131
-
132
-
133
-
134
-
135
-
136
-
137
-
138
-
139
-
140
-
141
-
142
-
143
-
144
-
145
-
146
-
147
-
148
-
149
-
150
-
151
-
152
-
153
-
154
-
155
-
156
-
157
-
158
-
159
-
160
-
161
-
162
-
163
-
164
-
165
-
166
-
167
-
168
-
169
-
170
-
171
-
172
-
173
-
174
-
175
-
176
-
177
-
178
-
179
-
180
-
181
-
182
-
183
-
184
-
185
-
186
-
187
-
188
-
189
-
190
-
191
-
192
-
193
-
194
-
195
-
196
-
197
-
198
-
199
-
200
-
201
-
202
-
203
-
204
-
205
-
206
-
207
-
208
-
209
-
210
-
211
-
212
-
213
-
214
-
215
-
216
-
217
-
218
-
219
-
220
-
221
-
222
-
223
-
224
-
225
-
226
-
227
-
228
-
229
-
230
-
231
-
232
-
233
-
234
-
235
-
236
-
237
-
238
-
239
-
240
-
241
-
242
-
243
-
244
-
245
-
246
-
247
-
248
-
249
-
250
-
251
-
252
-
253
-
254
-
255
-
256
-
257
-
258
-
259
 |
 |

35
PART II
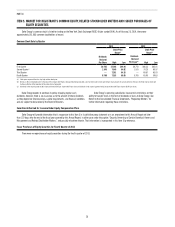
Commercial Power
Years Ended December 31,
(in millions) 2013 2012
Variance
2013 vs.
2012 2011
Variance
2012 vs.
2011
Operating Revenues $ 2,145 $ 2,078 $ 67 $ 2,491 $ (413)
Operating Expenses 2,178 1,981 197 2,300 (319)
(Losses) Gains on Sales of Other Assets and Other, net (23) 8 (31) 15 (7)
Operating (Loss) Income (56) 105 (161) 206 (101)
Other Income and Expense, net 13 39 (26) 21 18
Interest Expense 64 63 1 87 (24)
(Loss) Income Before Income Taxes (107) 81 (188) 140 (59)
Income Tax Benefit (104) (7) (97) (2) (5)
Less: Income Attributable to Noncontrolling Interests — 1 (1) 8 (7)
Segment (Loss) Income $ (3) $ 87 $ (90) $ 134 $ (47)
Coal-fired plant production, GWh 18,467 16,164 2,303 17,378 (1,214)
Gas-fired plant production, GWh 15,052 17,122 (2,070) 12,021 5,101
Renewable plant production, GWh 5,111 3,452 1,659 3,132 320
Total Commercial Power production, GWh 38,630 36,738 1,892 32,531 4,207
Net proportional MW capacity in operation 7,915 8,094 (179) 8,325 (231)
Year Ended December 31, 2013 as Compared to 2012
Commercial Power’s results were negatively impacted by lower PJM
capacity revenues and lower income from the renewables portfolio and gas-fired
generation assets. These impacts are partially offset by higher income tax
benefits and higher income from the coal-fired generation assets. The following
is a detailed discussion of the variance drivers by line item.
Operating Revenues. The variance was driven primarily by:
• A $102 million increase in net mark-to-market revenues on non-
qualifying power and capacity hedge contracts, consisting of mark-to-
market gains of $96 million in 2013 compared to losses of $6 million
in 2012;
• A $68 million increase for the gas-fired generation assets driven
primarily by higher power prices, partially offset by decreased volumes;
and
• A $67 million increase due to higher volumes in the renewables portfolio.
Partially offset by:
• An $85 million decrease in PJM capacity revenues related to lower
average cleared capacity auction pricing; and
• An $81 million decrease due primarily to the sale of non-core
businesses in 2012.
Operating Expenses. The variance was driven primarily by:
• A $109 million increase in fuel expenses from the gas-fired generation
assets driven by higher average natural gas prices per million British
Thermal Units (MMBtu), partially offset by decreased natural gas
volumes; and
• A $96 million increase in net mark-to-market fuel expenses on non-
qualifying fuel hedge contracts, consisting of mark-to-market losses of
$99 million in 2013 compared to losses of $3 million in 2012.
(Losses) Gains on Sales of Other Assets and Other, net. The variance
is attributable to a loss recognized on the sale of certain renewable development
projects in 2013 and a gain on the 2012 contribution of certain renewable assets
to a joint venture.
Other Income and Expense, net. The variance is primarily due to the
sale of non-core businesses in 2012, lower interest income and lower equity
earnings from the renewables portfolio.
Income Tax Benefit. The variance was primarily due to a decrease in both
pretax income and manufacturing deductions combined with higher production
tax credits in 2013. The effective tax rates for the years ended December 31,
2013 and 2012 were 97.2 percent and (9.5) percent, respectively. The increase
in the effective tax rate for the period was primarily due to a pretax loss in 2013
compared to pretax income in 2012.
Year Ended December 31, 2012 as Compared to 2011
Commercial Power’s results were negatively impacted by the net impact
of the expiration of the 2009-2011 ESP and the impact of competitive market
dispatch for the coal-fired assets, lower Duke Energy Retail earnings, and lower
PJM capacity revenues. These impacts were partially offset by lower operating
expenses, lower impairment charges, and increased margins from the gas-fired
generation assets. The following is a detailed discussion of the variance drivers
by line item.
Operating Revenues. The variance was driven primarily by:
• A $285 million decrease for the coal-fired generation assets driven
primarily by the expiration of the 2009-2011 ESP, net of stability charge
revenues under the 2012-2014 ESP, partially offset by participating in
the PJM wholesale energy market in 2012;
• A $116 million decrease for Duke Energy Retail resulting from lower
volumes and unfavorable pricing;