Duke Energy 2013 Annual Report Download - page 227
Download and view the complete annual report
Please find page 227 of the 2013 Duke Energy annual report below. You can navigate through the pages in the report by either clicking on the pages listed below, or by using the keyword search tool below to find specific information within the annual report.-
 1
1 -
2
-
3
-
4
-
5
-
6
-
7
-
8
-
9
-
10
-
11
-
12
-
13
-
14
-
15
-
16
-
17
-
18
-
19
-
20
-
21
-
22
-
23
-
24
-
25
-
26
-
27
-
28
-
29
-
30
-
31
-
32
-
33
-
34
-
35
-
36
-
37
-
38
-
39
-
40
-
41
-
42
-
43
-
44
-
45
-
46
-
47
-
48
-
49
-
50
-
51
-
52
-
53
-
54
-
55
-
56
-
57
-
58
-
59
-
60
-
61
-
62
-
63
-
64
-
65
-
66
-
67
-
68
-
69
-
70
-
71
-
72
-
73
-
74
-
75
-
76
-
77
-
78
-
79
-
80
-
81
-
82
-
83
-
84
-
85
-
86
-
87
-
88
-
89
-
90
-
91
-
92
-
93
-
94
-
95
-
96
-
97
-
98
-
99
-
100
-
101
-
102
-
103
-
104
-
105
-
106
-
107
-
108
-
109
-
110
-
111
-
112
-
113
-
114
-
115
-
116
-
117
-
118
-
119
-
120
-
121
-
122
-
123
-
124
-
125
-
126
-
127
-
128
-
129
-
130
-
131
-
132
-
133
-
134
-
135
-
136
-
137
-
138
-
139
-
140
-
141
-
142
-
143
-
144
-
145
-
146
-
147
-
148
-
149
-
150
-
151
-
152
-
153
-
154
-
155
-
156
-
157
-
158
-
159
-
160
-
161
-
162
-
163
-
164
-
165
-
166
-
167
-
168
-
169
-
170
-
171
-
172
-
173
-
174
-
175
-
176
-
177
-
178
-
179
-
180
-
181
-
182
-
183
-
184
-
185
-
186
-
187
-
188
-
189
-
190
-
191
-
192
-
193
-
194
-
195
-
196
-
197
-
198
-
199
-
200
-
201
-
202
-
203
-
204
-
205
-
206
-
207
-
208
-
209
-
210
-
211
-
212
-
213
-
214
-
215
-
216
-
 217
217 -
 218
218 -
 219
219 -
 220
220 -
 221
221 -
 222
222 -
 223
223 -
 224
224 -
 225
225 -
 226
226 -
 227
227 -
 228
228 -
 229
229 -
 230
230 -
 231
231 -
 232
232 -
 233
233 -
 234
234 -
 235
235 -
 236
236 -
 237
237 -
238
-
239
-
240
-
241
-
242
-
243
-
244
-
245
-
246
-
247
-
248
-
249
-
250
-
251
-
252
-
253
-
254
-
255
-
256
-
257
-
258
-
259
 |
 |

209
PART II
DUKE ENERGY CORPORATION • DUKE ENERGY CAROLINAS, LLC • PROGRESS ENERGY, INC. •
DUKE ENERGY PROGRESS, INC. • DUKE ENERGY FLORIDA, INC. • DUKE ENERGY OHIO, INC. • DUKE ENERGY INDIANA, INC.
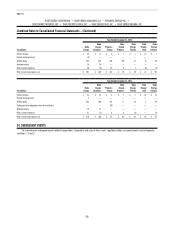
Combined Notes to Consolidated Financial Statements – (Continued)
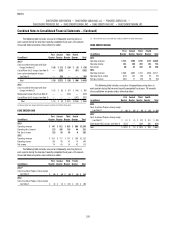
The following table includes unusual or infrequently occurring items in
each quarter during the two most recently completed fiscal years. All amounts
discussed below are pretax unless otherwise noted.
(in millions)
First
Quarter
Second
Quarter
Third
Quarter
Fourth
Quarter Total
2013(a)
Costs to achieve the merger with Duke
Energy (see Note 2) $ (8) $ (11) $ (10) $ (9) $ (38)
Crystal River Unit 3 charges (see Note 4) — (295) — (57) (352)
Levy nuclear development charges
(see Note 4) — (65) — — (65)
Total $ (8) $(371) $ (10) $ (66) $ (455)
2012
Costs to achieve the merger with Duke
Energy (see Note 2) $ (3) $ (8) $ (37) $ (46) $ (94)
Replacement power refund (see Note 4) — — (100) — (100)
Crystal River Unit 3 charges (see Note 4) — — — (192) (192)
Total $ (3) $ (8) $ (137) $ (238) $ (386)
(a) Revised retail rates became effective in January (see Note 4 for further information).
DUKE ENERGY OHIO
(in millions)
First
Quarter
Second
Quarter
Third
Quarter
Fourth
Quarter Total
2013
Operating revenues $ 747 $ 811 $ 819 $ 868 $3,245
Operating (loss) income (17) 108 116 44 251
Net (loss) income (21) 58 59 6 102
2012
Operating revenues $ 912 $ 717 $ 757 $ 766 $3,152
Operating income 138 95 42 74 349
Net income 74 45 14 42 175
The following table includes unusual or infrequently occurring items in
each quarter during the two most recently completed fiscal years. All amounts
discussed below are pretax unless otherwise noted.
(in millions)
First
Quarter
Second
Quarter
Third
Quarter
Fourth
Quarter Total
2013(a)
Costs to achieve Progress Energy merger
(see Note 2) $ (4) $ (4) $ (4) $ (4) $ (16)
2012
Costs to achieve Progress Energy merger
(see Note 2) $ (1) $ (1 ) $ (22) $ (12) $ (36)
(a) Revised retail rates became effective in May (see Note 4 for further information).
DUKE ENERGY INDIANA
(in millions)
First
Quarter
Second
Quarter
Third
Quarter
Fourth
Quarter Total
2013
Operating revenues $ 724 $700 $755 $747 $2,926
Operating income 181 168 203 181 733
Net income 90 82 104 82 358
2012
Operating revenues $ 688 $ 685 $718 $626 $2,717
Operating (loss) income (272) 134 (30) 93 (75)
Net (loss) income (167) 77 (19) 59 (50)
The following table includes unusual or infrequently occurring items in
each quarter during the two most recently completed fiscal years. All amounts
discussed below are pretax unless otherwise noted.
(in millions)
First
Quarter
Second
Quarter
Third
Quarter
Fourth
Quarter Total
2013
Costs to achieve Progress Energy merger
(see Note 2) $ (4) $ (5) $ (5) $ (5) $ (19)
2012
Costs to achieve Progress Energy merger
(see Note 2) $ (1) $ (1) $ (21) $ (11) $ (34)
Edwardsport IGCC charges (see Note 4) (420) — (180) (28) (628)
Total $ (421) $ (1) $ (201) $ (39) $ (662)