Duke Energy 2013 Annual Report Download - page 2
Download and view the complete annual report
Please find page 2 of the 2013 Duke Energy annual report below. You can navigate through the pages in the report by either clicking on the pages listed below, or by using the keyword search tool below to find specific information within the annual report.-
 1
1 -
 2
2 -
 3
3 -
 4
4 -
 5
5 -
 6
6 -
 7
7 -
 8
8 -
 9
9 -
 10
10 -
 11
11 -
 12
12 -
 13
13 -
14
-
15
-
16
-
17
-
18
-
19
-
20
-
21
-
22
-
23
-
24
-
25
-
26
-
27
-
28
-
29
-
30
-
31
-
32
-
33
-
34
-
35
-
36
-
37
-
38
-
39
-
40
-
41
-
42
-
43
-
44
-
45
-
46
-
47
-
48
-
49
-
50
-
51
-
52
-
53
-
54
-
55
-
56
-
57
-
58
-
59
-
60
-
61
-
62
-
63
-
64
-
65
-
66
-
67
-
68
-
69
-
70
-
71
-
72
-
73
-
74
-
75
-
76
-
77
-
78
-
79
-
80
-
81
-
82
-
83
-
84
-
85
-
86
-
87
-
88
-
89
-
90
-
91
-
92
-
93
-
94
-
95
-
96
-
97
-
98
-
99
-
100
-
101
-
102
-
103
-
104
-
105
-
106
-
107
-
108
-
109
-
110
-
111
-
112
-
113
-
114
-
115
-
116
-
117
-
118
-
119
-
120
-
121
-
122
-
123
-
124
-
125
-
126
-
127
-
128
-
129
-
130
-
131
-
132
-
133
-
134
-
135
-
136
-
137
-
138
-
139
-
140
-
141
-
142
-
143
-
144
-
145
-
146
-
147
-
148
-
149
-
150
-
151
-
152
-
153
-
154
-
155
-
156
-
157
-
158
-
159
-
160
-
161
-
162
-
163
-
164
-
165
-
166
-
167
-
168
-
169
-
170
-
171
-
172
-
173
-
174
-
175
-
176
-
177
-
178
-
179
-
180
-
181
-
182
-
183
-
184
-
185
-
186
-
187
-
188
-
189
-
190
-
191
-
192
-
193
-
194
-
195
-
196
-
197
-
198
-
199
-
200
-
201
-
202
-
203
-
204
-
205
-
206
-
207
-
208
-
209
-
210
-
211
-
212
-
213
-
214
-
215
-
216
-
217
-
218
-
219
-
220
-
221
-
222
-
223
-
224
-
225
-
226
-
227
-
228
-
229
-
230
-
231
-
232
-
233
-
234
-
235
-
236
-
237
-
238
-
239
-
240
-
241
-
242
-
243
-
244
-
245
-
246
-
247
-
248
-
249
-
250
-
251
-
252
-
253
-
254
-
255
-
256
-
257
-
258
-
259
 |
 |

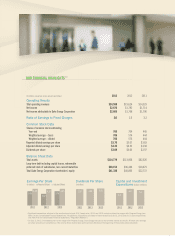
(In millions, except per-share amounts and ratios) 2013 2012 2011
Operating Results
Total operating revenues $24,598 $19,624 $14,529
Net income $2,676 $1,782 $1,714
Net income attributable to Duke Energy Corporation $2,665 $1,768 $1,706
Ratio of Earnings to Fixed Charges 3.0 2.5 3.2
Common Stock Data
Shares of common stock outstanding
Year-end 706 704 445
Weighted average – basic 706 574 444
Weighted average – diluted 706 575 444
Reported diluted earnings per share $3.76 $3.07 $3.83
Adjusted diluted earnings per share $4.35 $4.32 $4.38
Dividends per share $3.09 $3.03 $2.97
Balance Sheet Data
Total assets $114,779 $113,856 $62,526
Long-term debt including capital leases, redeemable
preferred stock of subsidiaries, less current maturities $38,152 $36,444 $18,679
Total Duke Energy Corporation shareholders’ equity $41,330 $40,863 $22,772
OUR FINANCIAL HIGHLIGHTSa,b
OUR FINANCIAL HIGHLIGHTS
Earnings Per Share
(in dollars) Reported Diluted Adjusted Diluted
2011
3.83
4.38
2013
3.76 4.35
2012
3.07
4.32
Capital and Investment
Expenditures (dollars in billions)
2013
5.6
2012
6.0
2011
4.5
a
Signicant transactions reected in the results above include: 2013 asset sales, 2013 and 2012 costs to achieve the merger with Progress Energy (see
Note 2 to the Consolidated Financial Statements, “Acquisitions, Dispositions and Sales of Other Assets”) and 2013, 2012 and 2011 asset impairments
(see Note 4 to the Consolidated Financial Statements, “Regulatory Matters”).
b
On July 2, 2012, immediately prior to the merger with Progress Energy, Duke Energy executed a one-for-three reverse stock split. All share and earnings
per share amounts are presented as if the one-for-three reverse stock split had been effective at the beginning of the earliest period presented.
Dividends Per Share
(in dollars)
2013
3.09
2011
2.97
2012
3.03
Annual Meeting
Website Addresses
Duplicate Mailings
Transfer Agent and Registrar
Dividend Payment