Duke Energy 2013 Annual Report Download - page 213
Download and view the complete annual report
Please find page 213 of the 2013 Duke Energy annual report below. You can navigate through the pages in the report by either clicking on the pages listed below, or by using the keyword search tool below to find specific information within the annual report.-
 1
1 -
2
-
3
-
4
-
5
-
6
-
7
-
8
-
9
-
10
-
11
-
12
-
13
-
14
-
15
-
16
-
17
-
18
-
19
-
20
-
21
-
22
-
23
-
24
-
25
-
26
-
27
-
28
-
29
-
30
-
31
-
32
-
33
-
34
-
35
-
36
-
37
-
38
-
39
-
40
-
41
-
42
-
43
-
44
-
45
-
46
-
47
-
48
-
49
-
50
-
51
-
52
-
53
-
54
-
55
-
56
-
57
-
58
-
59
-
60
-
61
-
62
-
63
-
64
-
65
-
66
-
67
-
68
-
69
-
70
-
71
-
72
-
73
-
74
-
75
-
76
-
77
-
78
-
79
-
80
-
81
-
82
-
83
-
84
-
85
-
86
-
87
-
88
-
89
-
90
-
91
-
92
-
93
-
94
-
95
-
96
-
97
-
98
-
99
-
100
-
101
-
102
-
103
-
104
-
105
-
106
-
107
-
108
-
109
-
110
-
111
-
112
-
113
-
114
-
115
-
116
-
117
-
118
-
119
-
120
-
121
-
122
-
123
-
124
-
125
-
126
-
127
-
128
-
129
-
130
-
131
-
132
-
133
-
134
-
135
-
136
-
137
-
138
-
139
-
140
-
141
-
142
-
143
-
144
-
145
-
146
-
147
-
148
-
149
-
150
-
151
-
152
-
153
-
154
-
155
-
156
-
157
-
158
-
159
-
160
-
161
-
162
-
163
-
164
-
165
-
166
-
167
-
168
-
169
-
170
-
171
-
172
-
173
-
174
-
175
-
176
-
177
-
178
-
179
-
180
-
181
-
182
-
183
-
184
-
185
-
186
-
187
-
188
-
189
-
190
-
191
-
192
-
193
-
194
-
195
-
196
-
197
-
198
-
199
-
200
-
201
-
202
-
 203
203 -
 204
204 -
 205
205 -
 206
206 -
 207
207 -
 208
208 -
 209
209 -
 210
210 -
 211
211 -
 212
212 -
 213
213 -
 214
214 -
 215
215 -
 216
216 -
 217
217 -
 218
218 -
 219
219 -
 220
220 -
 221
221 -
 222
222 -
 223
223 -
224
-
225
-
226
-
227
-
228
-
229
-
230
-
231
-
232
-
233
-
234
-
235
-
236
-
237
-
238
-
239
-
240
-
241
-
242
-
243
-
244
-
245
-
246
-
247
-
248
-
249
-
250
-
251
-
252
-
253
-
254
-
255
-
256
-
257
-
258
-
259
 |
 |

195
PART II
DUKE ENERGY CORPORATION • DUKE ENERGY CAROLINAS, LLC • PROGRESS ENERGY, INC. •
DUKE ENERGY PROGRESS, INC. • DUKE ENERGY FLORIDA, INC. • DUKE ENERGY OHIO, INC. • DUKE ENERGY INDIANA, INC.
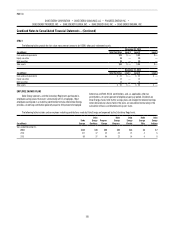
Combined Notes to Consolidated Financial Statements – (Continued)
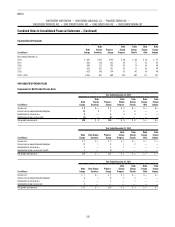
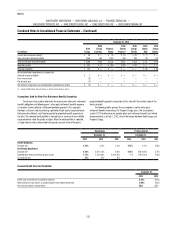
Progress Energy Master Retirement Trust
As of December 31, 2012, assets for Progress Energy qualified pension
benefits were maintained in the Progress Energy Master Retirement Trust.
As of January 1, 2013, assets previously held in the Progress Energy Master
Retirement Trust were transferred into the Duke Energy Master Retirement Trust.
The following table includes the actual asset allocations for the Progress Energy
Master Retirement Trust at December 31, 2012.
Actual Allocation at December 31,
2012
U.S. equity securities 20 %
Non-U.S. equity securities 14 %
Global equity securities 8 %
Global private equity securities 10 %
Debt securities 35 %
Hedge funds 9 %
Real estate and cash 1 %
Other global securities 3 %
Total 100 %
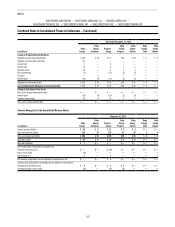
VEBA I
Duke Energy also invests other post-retirement assets in the Duke Energy
Corporation Employee Benefits Trust (VEBA I). The investment objective of VEBA
I is to achieve sufficient returns, subject to a prudent level of portfolio risk, for
the purpose of promoting the security of plan benefits for participants. VEBA I is
passively managed.
The following table includes the weighted-average returns expected by
asset classes and the target asset allocations at December 31, 2013 and the
actual asset allocations for VEBA I.
Target
Allocation
Actual Allocation at December 31,
2013 2012
U.S. equity securities 30 % 29 % 23 %
Debt securities 45 % 29 % 32 %
Cash 25 % 42 % 45 %
Total 100 % 100 % 100 %
Fair Value Measurements
Duke Energy classifies recurring and non-recurring fair value
measurements based on the fair value hierarchy as discussed in Note 16.
Valuation methods of the primary fair value measurements disclosed
above are as follows:
Investments in equity securities
Investments in equity securities, other than those accounted for as equity
and cost method investments, are typically valued at the closing price in the
principal active market as of the last business day of the reporting period. Principal
active markets for equity prices include published exchanges such as NASDAQ
and NYSE. Foreign equity prices are translated from their trading currency using
the currency exchange rate in effect at the close of the principal active market.
Prices have not been adjusted to reflect after-hours market activity. The majority of
investments in equity securities are valued using Level 1 measurements. When (i)
the Duke Energy Registrants lack the ability to redeem investments valued on a net
asset value per share basis at net asset value per share in the near future or (ii)
net asset value per share is not available at the measurement date, the fair value
measurement of the investment is categorized as Level 3.
Investments in debt securities
Most debt investments are valued based on a calculation using interest
rate curves and credit spreads applied to the terms of the debt instrument
(maturity and coupon interest rate) and consider the counterparty credit rating.
Most debt valuations are Level 2 measurements. If the market for a particular
fixed income security is relatively inactive or illiquid, the measurement is Level
3. U.S. Treasury debt is typically Level 1.
Investments in short-term investment funds
Investments in short-term investment funds are valued at the net
asset value of units held at year end. Investments in short-term investment
funds with published prices are valued as Level 1. Investments in short-term
investment funds with unpublished prices are valued as Level 2.
Investments in real estate investment trusts
Investments in real estate investment trusts are valued based upon
property appraisal reports prepared by independent real estate appraisers. The
Chief Real Estate Appraiser of the asset manager is responsible for assuring
that the valuation process provides independent and reasonable property
market value estimates. An external appraisal management firm not affiliated
with the asset manager has been appointed to assist the Chief Real Estate
Appraiser in maintaining and monitoring the independence and the accuracy of
the appraisal process.