Duke Energy 2013 Annual Report Download - page 196
Download and view the complete annual report
Please find page 196 of the 2013 Duke Energy annual report below. You can navigate through the pages in the report by either clicking on the pages listed below, or by using the keyword search tool below to find specific information within the annual report.-
 1
1 -
2
-
3
-
4
-
5
-
6
-
7
-
8
-
9
-
10
-
11
-
12
-
13
-
14
-
15
-
16
-
17
-
18
-
19
-
20
-
21
-
22
-
23
-
24
-
25
-
26
-
27
-
28
-
29
-
30
-
31
-
32
-
33
-
34
-
35
-
36
-
37
-
38
-
39
-
40
-
41
-
42
-
43
-
44
-
45
-
46
-
47
-
48
-
49
-
50
-
51
-
52
-
53
-
54
-
55
-
56
-
57
-
58
-
59
-
60
-
61
-
62
-
63
-
64
-
65
-
66
-
67
-
68
-
69
-
70
-
71
-
72
-
73
-
74
-
75
-
76
-
77
-
78
-
79
-
80
-
81
-
82
-
83
-
84
-
85
-
86
-
87
-
88
-
89
-
90
-
91
-
92
-
93
-
94
-
95
-
96
-
97
-
98
-
99
-
100
-
101
-
102
-
103
-
104
-
105
-
106
-
107
-
108
-
109
-
110
-
111
-
112
-
113
-
114
-
115
-
116
-
117
-
118
-
119
-
120
-
121
-
122
-
123
-
124
-
125
-
126
-
127
-
128
-
129
-
130
-
131
-
132
-
133
-
134
-
135
-
136
-
137
-
138
-
139
-
140
-
141
-
142
-
143
-
144
-
145
-
146
-
147
-
148
-
149
-
150
-
151
-
152
-
153
-
154
-
155
-
156
-
157
-
158
-
159
-
160
-
161
-
162
-
163
-
164
-
165
-
166
-
167
-
168
-
169
-
170
-
171
-
172
-
173
-
174
-
175
-
176
-
177
-
178
-
179
-
180
-
181
-
182
-
183
-
184
-
185
-
 186
186 -
 187
187 -
 188
188 -
 189
189 -
 190
190 -
 191
191 -
 192
192 -
 193
193 -
 194
194 -
 195
195 -
 196
196 -
 197
197 -
 198
198 -
 199
199 -
 200
200 -
 201
201 -
 202
202 -
 203
203 -
 204
204 -
 205
205 -
 206
206 -
207
-
208
-
209
-
210
-
211
-
212
-
213
-
214
-
215
-
216
-
217
-
218
-
219
-
220
-
221
-
222
-
223
-
224
-
225
-
226
-
227
-
228
-
229
-
230
-
231
-
232
-
233
-
234
-
235
-
236
-
237
-
238
-
239
-
240
-
241
-
242
-
243
-
244
-
245
-
246
-
247
-
248
-
249
-
250
-
251
-
252
-
253
-
254
-
255
-
256
-
257
-
258
-
259
 |
 |

178
PART II
DUKE ENERGY CORPORATION • DUKE ENERGY CAROLINAS, LLC • PROGRESS ENERGY, INC. •
DUKE ENERGY PROGRESS, INC. • DUKE ENERGY FLORIDA, INC. • DUKE ENERGY OHIO, INC. • DUKE ENERGY INDIANA, INC.
Combined Notes to Consolidated Financial Statements – (Continued)
20. STOCK-BASED COMPENSATION
Duke Energy’s 2010 Long-Term Incentive Plan (the 2010 Plan) reserved
25 million shares of common stock for awards to employees and outside
directors. Duke Energy has historically issued new shares upon exercising or
vesting of share-based awards. However, Duke Energy may use a combination
of new share issuances and open market repurchases for share-based
awards that are exercised or become vested in the future. Duke Energy has not
determined with certainty the amount of such new share issuances or open
market repurchases.
The 2010 Plan allows for a maximum of 6.25 million shares of common
stock to be issued under various stock-based awards other than options and
stock appreciation rights.
In connection with the acquisition of Progress Energy in July 2012,
Duke Energy assumed Progress Energy’s 2007 Equity Incentive Plan (EIP).
Stock-based awards granted under the Progress Energy EIP and held by
Progress Energy employees were generally converted into outstanding Duke
Energy stock-based compensation awards. The estimated fair value of these
awards allocated to purchase price was $62 million. Refer to Note 2 for further
information regarding the merger transaction.
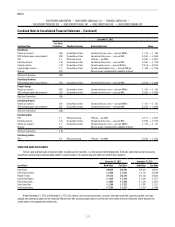
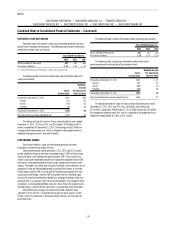
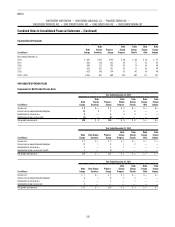
The following table summarizes the total expense recognized by each of
the Duke Energy Registrants, net of tax, for stock-based compensation.
Years Ended December 31,
(in millions) 2013 2012 2011
Duke Energy $ 52 $ 48 $ 32
Duke Energy Carolinas 13 12 17
Progress Energy 23 25 20
Duke Energy Progress 14 16 12
Duke Energy Florida 9 9 8
Duke Energy Ohio 4 4 6
Duke Energy Indiana 4 4 4
Pretax stock-based compensation costs, the tax benefit associated with
stock-based compensation expense, and stock-based compensation costs
capitalized are included in the following table.
Years Ended December 31,
(in millions) 2013 2012 2011
Stock options $ 2 $ 2 $ 2
Restricted stock unit awards 49 43 27
Performance awards 34 33 23
Pretax stock-based compensation cost $ 85 $ 78 $ 52
Tax benefit associated with stock-based
compensation expense $ 33 $ 30 $ 20
Stock-based compensation costs capitalized 3 2 2
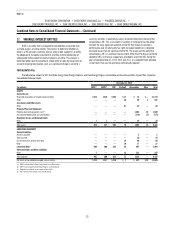
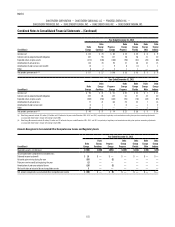
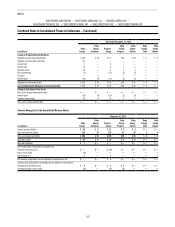
STOCK OPTIONS
The following table summarizes information about stock options
outstanding.
Options
(in thousands)
Weighted-
Average
Exercise
Price
Weighted-
Average
Remain-
ing Life
Aggregate
Intrinsic
Value
(in millions)
Outstanding at
December 31, 2012 1,654 $ 51
Granted 310 69
Exercised (1,162) 48
Forfeited or expired (9) 41
Outstanding at
December 31, 2013 793 61 7y, 3m $ 6
Exercisable at
December 31, 2013 137 46 1y, 5m 3
Options expected to vest 656 64 8y, 5m 3
The exercise price of each option granted cannot be less than the market
price of Duke Energy’s common stock on the date of grant and the maximum
option term is 10 years. The vesting periods range from immediate to three
years. Options granted in 2013 and 2012 were expensed immediately; therefore,
there is no future compensation cost associated with these options. The
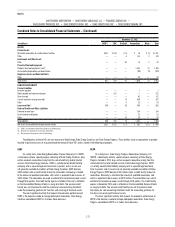
following table includes information related to Duke Energy’s stock options.
Years Ended December 31,
(in millions) 2013 2012 2011
Intrinsic value of options exercised $ 26 $ 17 $ 26
Tax benefit related to options exercised 10 7 10
Cash received from options exercised 9 21 74
Stock options granted (in thousands) 310 340 358
The following assumptions were used to determine the grant date fair
value of stock options granted in 2013.
Risk-free interest rate(a) 1.0 %
Expected dividend yield(b) 4.7 %
Expected life(c) 6 years
Expected volatility(d) 18.1 %
(a) The risk-free rate is based upon the average of five-year and seven-year U.S. Treasury Constant Maturity
rates as of the grant date.
(b) The expected dividend yield is based upon the most recent annualized dividend and the one-year average
closing stock price.
(c) The expected life of options is derived from the simplified method approach.
(d) Volatility is based equally between historical and implied volatility. Historic volatility is based on Duke
Energy’s historical volatility over the expected life using daily stock prices. Implied volatility is the average
for all option contracts with a term greater than six months using the strike price closest to the stock
price on the valuation date.