Duke Energy 2013 Annual Report Download - page 147
Download and view the complete annual report
Please find page 147 of the 2013 Duke Energy annual report below. You can navigate through the pages in the report by either clicking on the pages listed below, or by using the keyword search tool below to find specific information within the annual report.-
 1
1 -
2
-
3
-
4
-
5
-
6
-
7
-
8
-
9
-
10
-
11
-
12
-
13
-
14
-
15
-
16
-
17
-
18
-
19
-
20
-
21
-
22
-
23
-
24
-
25
-
26
-
27
-
28
-
29
-
30
-
31
-
32
-
33
-
34
-
35
-
36
-
37
-
38
-
39
-
40
-
41
-
42
-
43
-
44
-
45
-
46
-
47
-
48
-
49
-
50
-
51
-
52
-
53
-
54
-
55
-
56
-
57
-
58
-
59
-
60
-
61
-
62
-
63
-
64
-
65
-
66
-
67
-
68
-
69
-
70
-
71
-
72
-
73
-
74
-
75
-
76
-
77
-
78
-
79
-
80
-
81
-
82
-
83
-
84
-
85
-
86
-
87
-
88
-
89
-
90
-
91
-
92
-
93
-
94
-
95
-
96
-
97
-
98
-
99
-
100
-
101
-
102
-
103
-
104
-
105
-
106
-
107
-
108
-
109
-
110
-
111
-
112
-
113
-
114
-
115
-
116
-
117
-
118
-
119
-
120
-
121
-
122
-
123
-
124
-
125
-
126
-
127
-
128
-
129
-
130
-
131
-
132
-
133
-
134
-
135
-
136
-
 137
137 -
 138
138 -
 139
139 -
 140
140 -
 141
141 -
 142
142 -
 143
143 -
 144
144 -
 145
145 -
 146
146 -
 147
147 -
 148
148 -
 149
149 -
 150
150 -
 151
151 -
 152
152 -
 153
153 -
 154
154 -
 155
155 -
 156
156 -
 157
157 -
158
-
159
-
160
-
161
-
162
-
163
-
164
-
165
-
166
-
167
-
168
-
169
-
170
-
171
-
172
-
173
-
174
-
175
-
176
-
177
-
178
-
179
-
180
-
181
-
182
-
183
-
184
-
185
-
186
-
187
-
188
-
189
-
190
-
191
-
192
-
193
-
194
-
195
-
196
-
197
-
198
-
199
-
200
-
201
-
202
-
203
-
204
-
205
-
206
-
207
-
208
-
209
-
210
-
211
-
212
-
213
-
214
-
215
-
216
-
217
-
218
-
219
-
220
-
221
-
222
-
223
-
224
-
225
-
226
-
227
-
228
-
229
-
230
-
231
-
232
-
233
-
234
-
235
-
236
-
237
-
238
-
239
-
240
-
241
-
242
-
243
-
244
-
245
-
246
-
247
-
248
-
249
-
250
-
251
-
252
-
253
-
254
-
255
-
256
-
257
-
258
-
259
 |
 |

129
PART II
DUKE ENERGY CORPORATION • DUKE ENERGY CAROLINAS, LLC • PROGRESS ENERGY, INC. •
DUKE ENERGY PROGRESS, INC. • DUKE ENERGY FLORIDA, INC. • DUKE ENERGY OHIO, INC. • DUKE ENERGY INDIANA, INC.
Combined Notes to Consolidated Financial Statements – (Continued)
OTHER COMMITMENTS AND CONTINGENCIES
General
As part of their normal business, the Duke Energy Registrants are party
to various nancial guarantees, performance guarantees, and other contractual
commitments to extend guarantees of credit and other assistance to various
subsidiaries, investees, and other third parties. These guarantees involve
elements of performance and credit risk, which are not fully recognized on the
Consolidated Balance Sheets and have unlimited maximum potential payments.
However, the Duke Energy Registrants do not believe these guarantees will have
a material effect on their results of operations, cash ows or nancial position.
Purchase Obligations
Purchased Power
Duke Energy Progress, Duke Energy Florida, and Duke Energy Ohio have
ongoing purchased power contracts, including renewable energy contracts, with
other utilities, wholesale marketers, co-generators, and qualied facilities (QFs).
These purchased power contracts generally provide for capacity and energy
payments. In addition, Duke Energy Progress, Duke Energy Florida, and Duke
Energy Ohio have various contracts to secure transmission rights.
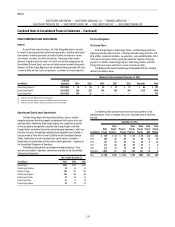
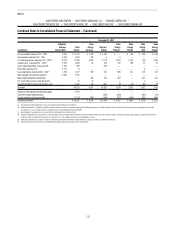
The following table presents executory purchased power contracts, excluding
contracts classied as leases.
Minimum Purchase Amount at December 31, 2013
(in millions)
Contract
Expiration 2014 2015 2016 2017 2018 Thereafter Total
Duke Energy Progress(a) 2019-2022 $ 36 $ 36 $ 36 $ 37 $ 37 $ 69 $ 251
Duke Energy Florida(b) 2014-2025 288 295 295 288 303 2,139 3,608
Duke Energy Ohio(c) 2014-2015 250 97 — — — — 347
(a) Contracts represent 100 percent of net plant output.
(b) Contracts represent between 2 percent and 100 percent of net plant output.
(c) Contracts represent between 1 percent and 24 percent of net plant output.
Operating and Capital Lease Commitments
The Duke Energy Registrants lease ofce buildings, railcars, vehicles,
computer equipment and other property and equipment with various terms and
expiration dates. Additionally, Duke Energy Progress has a capital lease related
to rm gas pipeline transportation capacity. Duke Energy Progress and Duke
Energy Florida have entered into certain purchased power agreements, which are
classied as leases. Consolidated capitalized lease obligations are classied as
Long-term debt or Other within Current Liabilities on the Consolidated Balance
Sheets. Amortization of assets recorded under capital leases is included in
Depreciation and amortization and Fuel used in electric generation – regulated on
the Consolidated Statements of Operations.
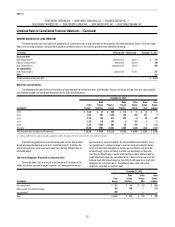
The following table presents rental expense for operating leases. These
amounts are included in Operation, maintenance and other on the Consolidated
Statements of Operations.
Years Ended December 31,
(in millions) 2013 2012 2011
Duke Energy $321 $232 $104
Duke Energy Carolinas 39 38 43
Progress Energy 225 232 104
Duke Energy Progress 153 164 88
Duke Energy Florida 72 68 15
Duke Energy Ohio 14 14 19
Duke Energy Indiana 22 20 24
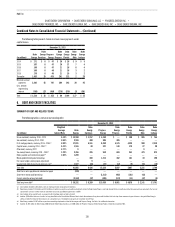
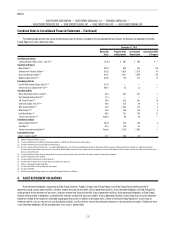
The following table presents future minimum lease payments under
operating leases, which at inception had a non-cancelable term of more than
one year.
December 31, 2013
(in millions)
Duke
Energy
Duke
Energy
Carolinas
Progress
Energy
Duke
Energy
Progress
Duke
Energy
Florida
Duke
Energy
Ohio
Duke
Energy
Indiana
2014 $ 175 $ 34 $ 93 $ 55 $ 39 $ 12 $18
2015 159 29 89 51 39 11 15
2016 147 24 90 51 39 8 12
2017 137 20 89 50 39 7 9
2018 117 15 78 40 38 5 7
Thereafter 1,034 67 773 459 314 18 8
Total $1,769 $189 $ 1,212 $706 $508 $ 61 $69