Duke Energy 2013 Annual Report Download - page 180
Download and view the complete annual report
Please find page 180 of the 2013 Duke Energy annual report below. You can navigate through the pages in the report by either clicking on the pages listed below, or by using the keyword search tool below to find specific information within the annual report.-
 1
1 -
2
-
3
-
4
-
5
-
6
-
7
-
8
-
9
-
10
-
11
-
12
-
13
-
14
-
15
-
16
-
17
-
18
-
19
-
20
-
21
-
22
-
23
-
24
-
25
-
26
-
27
-
28
-
29
-
30
-
31
-
32
-
33
-
34
-
35
-
36
-
37
-
38
-
39
-
40
-
41
-
42
-
43
-
44
-
45
-
46
-
47
-
48
-
49
-
50
-
51
-
52
-
53
-
54
-
55
-
56
-
57
-
58
-
59
-
60
-
61
-
62
-
63
-
64
-
65
-
66
-
67
-
68
-
69
-
70
-
71
-
72
-
73
-
74
-
75
-
76
-
77
-
78
-
79
-
80
-
81
-
82
-
83
-
84
-
85
-
86
-
87
-
88
-
89
-
90
-
91
-
92
-
93
-
94
-
95
-
96
-
97
-
98
-
99
-
100
-
101
-
102
-
103
-
104
-
105
-
106
-
107
-
108
-
109
-
110
-
111
-
112
-
113
-
114
-
115
-
116
-
117
-
118
-
119
-
120
-
121
-
122
-
123
-
124
-
125
-
126
-
127
-
128
-
129
-
130
-
131
-
132
-
133
-
134
-
135
-
136
-
137
-
138
-
139
-
140
-
141
-
142
-
143
-
144
-
145
-
146
-
147
-
148
-
149
-
150
-
151
-
152
-
153
-
154
-
155
-
156
-
157
-
158
-
159
-
160
-
161
-
162
-
163
-
164
-
165
-
166
-
167
-
168
-
169
-
 170
170 -
 171
171 -
 172
172 -
 173
173 -
 174
174 -
 175
175 -
 176
176 -
 177
177 -
 178
178 -
 179
179 -
 180
180 -
 181
181 -
 182
182 -
 183
183 -
 184
184 -
 185
185 -
 186
186 -
 187
187 -
 188
188 -
 189
189 -
 190
190 -
191
-
192
-
193
-
194
-
195
-
196
-
197
-
198
-
199
-
200
-
201
-
202
-
203
-
204
-
205
-
206
-
207
-
208
-
209
-
210
-
211
-
212
-
213
-
214
-
215
-
216
-
217
-
218
-
219
-
220
-
221
-
222
-
223
-
224
-
225
-
226
-
227
-
228
-
229
-
230
-
231
-
232
-
233
-
234
-
235
-
236
-
237
-
238
-
239
-
240
-
241
-
242
-
243
-
244
-
245
-
246
-
247
-
248
-
249
-
250
-
251
-
252
-
253
-
254
-
255
-
256
-
257
-
258
-
259
 |
 |

162
PART II
DUKE ENERGY CORPORATION • DUKE ENERGY CAROLINAS, LLC • PROGRESS ENERGY, INC. •
DUKE ENERGY PROGRESS, INC. • DUKE ENERGY FLORIDA, INC. • DUKE ENERGY OHIO, INC. • DUKE ENERGY INDIANA, INC.
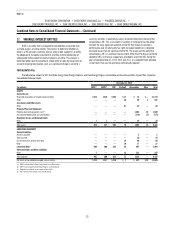
Combined Notes to Consolidated Financial Statements – (Continued)
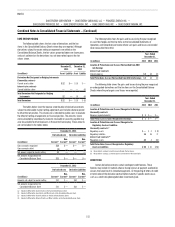
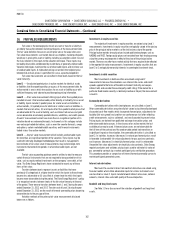
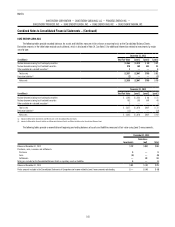
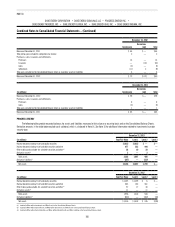
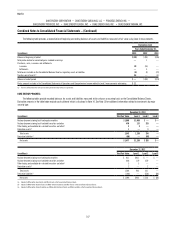
16. FAIR VALUE MEASUREMENTS
Fair value is the exchange price to sell an asset or transfer a liability in
an orderly transaction between market participants at the measurement date.
The fair value definition focuses on an exit price versus the acquisition cost.
Fair value measurements use market data or assumptions market participants
would use in pricing the asset or liability, including assumptions about risk and
the risks inherent in the inputs to the valuation technique. These inputs may
be readily observable, corroborated by market data, or generally unobservable.
Valuation techniques maximize the use of observable inputs and minimize use
of unobservable inputs. A midmarket pricing convention (the midpoint price
between bid and ask prices) is permitted for use as a practical expedient.
Fair value measurements are classified in three levels based on the fair
value hierarchy:
Level 1 — Unadjusted quoted prices in active markets for identical assets
or liabilities that the reporting entity can access at the measurement date. An
active market is one in which transactions for an asset or liability occur with
sufficient frequency and volume to provide ongoing pricing information.
Level 2 — A fair value measurement utilizing inputs other than quoted prices
included in Level 1 that are observable, either directly or indirectly, for an asset
or liability. Inputs include (i) quoted prices for similar assets or liabilities in
active markets, (ii) quoted prices for identical or similar assets or liabilities in
markets that are not active, (iii) and inputs other than quoted market prices that
are observable for the asset or liability, such as interest rate curves and yield
curves observable at commonly quoted intervals, volatilities, and credit spreads.
A Level 2 measurement cannot have more than an insignificant portion of its
valuation based on unobservable inputs. Instruments in this category include
non-exchange-traded derivatives, such as over-the-counter forwards, swaps
and options; certain marketable debt securities; and financial instruments
traded in less than active markets.
Level 3 — Any fair value measurement which includes unobservable inputs
for more than an insignificant portion of the valuation. These inputs may be
used with internally developed methodologies that result in management’s
best estimate of fair value. Level 3 measurements may include longer-term
instruments that extend into periods in which observable inputs are not
available.
The fair value accounting guidance permits entities to elect to measure
certain financial instruments that are not required to be accounted for at fair
value, such as equity method investments or the company’s own debt, at fair
value. The Duke Energy Registrants have not elected to record any of these
items at fair value.
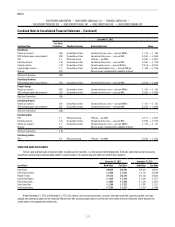
Transfers between levels represent assets or liabilities that were
previously (i) categorized at a higher level for which the inputs to the estimate
became less observable or (ii) classified at a lower level for which the inputs
became more observable during the period. The Duke Energy Registrant’s policy
is to recognize transfers between levels of the fair value hierarchy at the end
of the period. There were no transfers between levels 1 and 2 during the years
ended December 31, 2013 and 2012. Transfers out of Level 3 during the year
ended December 31, 2013 are the result of forward commodity prices becoming
observable due to the passage of time.
Valuation methods of the primary fair value measurements disclosed
below are as follows.
Investments in equity securities
The majority of investments in equity securities are valued using Level 1
measurements. Investments in equity securities are typically valued at the closing
price in the principal active market as of the last business day of the quarter.
Principal active markets for equity prices include published exchanges such as
NASDAQ and NYSE. Foreign equity prices are translated from their trading currency
using the currency exchange rate in effect at the close of the principal active
market. There was no after-hours market activity that was required to be reflected
in the reported fair value measurements. Investments in equity securities that are
Level 2 or 3 are typically ownership interests in commingled investment funds.
Investments in debt securities
Most investments in debt securities are valued using Level 2
measurements because the valuations uses interest rate curves and credit
spreads applied to the terms of the debt instrument (maturity and coupon
interest rate) and consider the counterparty credit rating. If the market for a
particular fixed income security is relatively inactive or illiquid, the measurement
is Level 3.
Commodity derivatives
Commodity derivatives with clearinghouses are classified as Level 1.
Other commodity derivatives are primarily fair valued using internally developed
discounted cash flow models which incorporate forward price, adjustments for
liquidity (bid-ask spread) and credit or non-performance risk (after reflecting
credit enhancements such as collateral), and are discounted to present value.
Pricing inputs are derived from published exchange transaction prices and
other observable data sources. In the absence of an active market, the last
available price may be used. If forward price curves are not observable for
the full term of the contract and the unobservable period had more than an
insignificant impact on the valuation, the commodity derivative is classified as
Level 3. In isolation, increases (decreases) in natural gas forward prices result
in favorable (unfavorable) fair value adjustments for gas purchase contracts;
and increases (decreases) in electricity forward prices result in unfavorable
(favorable) fair value adjustments for electricity sales contracts. Duke Energy
regularly evaluates and validates pricing inputs used to estimate fair value of
gas commodity contracts by a market participant price verification procedure.
This procedure provides a comparison of internal forward commodity curves to
market participant generated curves.
Interest rate derivatives
Most over-the-counter interest rate contract derivatives are valued using
financial models which utilize observable inputs for similar instruments and
are classified as Level 2. Inputs include forward interest rate curves, notional
amounts, interest rates and credit quality of the counterparties.
Goodwill and long-lived assets
See Note 11 for a discussion of the valuation of goodwill and long-lived
assets.