Duke Energy 2013 Annual Report Download - page 131
Download and view the complete annual report
Please find page 131 of the 2013 Duke Energy annual report below. You can navigate through the pages in the report by either clicking on the pages listed below, or by using the keyword search tool below to find specific information within the annual report.-
 1
1 -
2
-
3
-
4
-
5
-
6
-
7
-
8
-
9
-
10
-
11
-
12
-
13
-
14
-
15
-
16
-
17
-
18
-
19
-
20
-
21
-
22
-
23
-
24
-
25
-
26
-
27
-
28
-
29
-
30
-
31
-
32
-
33
-
34
-
35
-
36
-
37
-
38
-
39
-
40
-
41
-
42
-
43
-
44
-
45
-
46
-
47
-
48
-
49
-
50
-
51
-
52
-
53
-
54
-
55
-
56
-
57
-
58
-
59
-
60
-
61
-
62
-
63
-
64
-
65
-
66
-
67
-
68
-
69
-
70
-
71
-
72
-
73
-
74
-
75
-
76
-
77
-
78
-
79
-
80
-
81
-
82
-
83
-
84
-
85
-
86
-
87
-
88
-
89
-
90
-
91
-
92
-
93
-
94
-
95
-
96
-
97
-
98
-
99
-
100
-
101
-
102
-
103
-
104
-
105
-
106
-
107
-
108
-
109
-
110
-
111
-
112
-
113
-
114
-
115
-
116
-
117
-
118
-
119
-
120
-
 121
121 -
 122
122 -
 123
123 -
 124
124 -
 125
125 -
 126
126 -
 127
127 -
 128
128 -
 129
129 -
 130
130 -
 131
131 -
 132
132 -
 133
133 -
 134
134 -
 135
135 -
 136
136 -
 137
137 -
 138
138 -
 139
139 -
 140
140 -
 141
141 -
142
-
143
-
144
-
145
-
146
-
147
-
148
-
149
-
150
-
151
-
152
-
153
-
154
-
155
-
156
-
157
-
158
-
159
-
160
-
161
-
162
-
163
-
164
-
165
-
166
-
167
-
168
-
169
-
170
-
171
-
172
-
173
-
174
-
175
-
176
-
177
-
178
-
179
-
180
-
181
-
182
-
183
-
184
-
185
-
186
-
187
-
188
-
189
-
190
-
191
-
192
-
193
-
194
-
195
-
196
-
197
-
198
-
199
-
200
-
201
-
202
-
203
-
204
-
205
-
206
-
207
-
208
-
209
-
210
-
211
-
212
-
213
-
214
-
215
-
216
-
217
-
218
-
219
-
220
-
221
-
222
-
223
-
224
-
225
-
226
-
227
-
228
-
229
-
230
-
231
-
232
-
233
-
234
-
235
-
236
-
237
-
238
-
239
-
240
-
241
-
242
-
243
-
244
-
245
-
246
-
247
-
248
-
249
-
250
-
251
-
252
-
253
-
254
-
255
-
256
-
257
-
258
-
259
 |
 |

113
PART II
DUKE ENERGY CORPORATION • DUKE ENERGY CAROLINAS, LLC • PROGRESS ENERGY, INC. •
DUKE ENERGY PROGRESS, INC. • DUKE ENERGY FLORIDA, INC. • DUKE ENERGY OHIO, INC. • DUKE ENERGY INDIANA, INC.
Combined Notes to Consolidated Financial Statements – (Continued)
DUKE ENERGY CAROLINAS, PROGRESS ENERGY, DUKE ENERGY PROGRESS,
DUKE ENERGY FLORIDA AND DUKE ENERGY INDIANA
Duke Energy Carolinas, Progress Energy, Duke Energy Progress, Duke
Energy Florida and Duke Energy Indiana each have one reportable operating
segment, Regulated Utility, which generates, transmits, distributes and sells
electricity. The remainder of each company’s operations is classied as Other.
While not considered a reportable segment for any of these companies, Other
consists of certain unallocated corporate costs. Other for Progress Energy also
includes interest expense on corporate debt instruments of $300 million, $304
million and $324 million for the years ended December 31, 2013, 2012 and
2011. The following table summarizes the net loss for Other for each of these
entities.
Years Ended December 31,
(in millions) 2013 2012 2011
Duke Energy Carolinas $ (97) $ (169) $ (46 )
Progress Energy (241) (379) (273)
Duke Energy Progress (46) (139) (18)
Duke Energy Florida (24) (58) (16)
Duke Energy Indiana (16) (27) (12)
Duke Energy Progress earned approximately 10 percent of its consolidated
operating revenues from North Carolina Electric Membership Corporation
(NCEMC) in 2013. These revenues relate to wholesale contracts and
transmission revenues. The respective Regulated Utility and Regulated Utilities
operating segments own substantially all of Duke Energy Carolinas’, Progress
Energy’s, Duke Energy Progress’, Duke Energy Florida’s and Duke Energy
Indiana’s assets at December 31, 2013, 2012 and 2011.
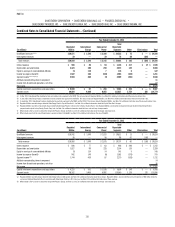
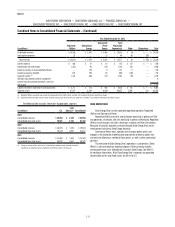
4. REGULATORY MATTERS
REGULATORY ASSETS AND LIABILITIES
The Duke Energy Registrants record regulatory assets and liabilities that result from the ratemaking process. See Note 1 for further information.
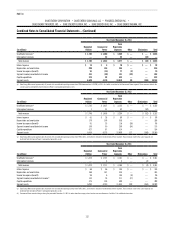
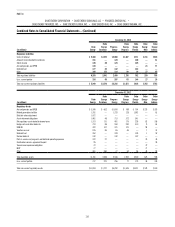
The following tables present the regulatory assets and liabilities recorded on the Consolidated Balance Sheets.
December 31, 2013
(in millions)
Duke
Energy
Duke
Energy
Carolinas
Progress
Energy
Duke
Energy
Progress
Duke
Energy
Florida
Duke
Energy
Ohio
Duke
Energy
Indiana
Regulatory Assets
Accrued pension and OPEB $ 1,723 $ 347 $ 750 $ 269 $ 438 $120 $219
Retired generation facilities 1,748 68 1,619 241 1,378 — 61
Debt fair value adjustment 1,338 — — — — — —
Asset retirement obligations 1,608 123 786 389 397 — —
Net regulatory asset related to income taxes 1,115 555 331 113 218 72 157
Hedge costs and other deferrals 450 98 318 165 153 5 29
Demand side management (DSM)/Energy efciency (EE) 371 140 152 140 12 79 —
Vacation accrual 210 82 55 50 — 7 13
Deferred fuel 94 — 37 6 31 14 43
Nuclear deferral 262 40 222 77 145 — —
Post-in-service carrying costs and deferred operating expenses 459 150 137 19 118 21 151
Gasication services agreement buyout 75 — — — — — 75
Transmission expansion obligation 70 — — — — 74 —
Manufactured gas plant (MGP) 90 — — — — 90 —
Other 473 219 101 42 60 46 87
Total regulatory assets 10,086 1,822 4,508 1,511 2,950 528 835
Less: current portion 895 295 353 127 221 57 118
Total non-current regulatory assets $ 9,191 $1,527 $ 4,155 $1,384 $2,729 $471 $717