Duke Energy 2013 Annual Report Download - page 126
Download and view the complete annual report
Please find page 126 of the 2013 Duke Energy annual report below. You can navigate through the pages in the report by either clicking on the pages listed below, or by using the keyword search tool below to find specific information within the annual report.-
 1
1 -
2
-
3
-
4
-
5
-
6
-
7
-
8
-
9
-
10
-
11
-
12
-
13
-
14
-
15
-
16
-
17
-
18
-
19
-
20
-
21
-
22
-
23
-
24
-
25
-
26
-
27
-
28
-
29
-
30
-
31
-
32
-
33
-
34
-
35
-
36
-
37
-
38
-
39
-
40
-
41
-
42
-
43
-
44
-
45
-
46
-
47
-
48
-
49
-
50
-
51
-
52
-
53
-
54
-
55
-
56
-
57
-
58
-
59
-
60
-
61
-
62
-
63
-
64
-
65
-
66
-
67
-
68
-
69
-
70
-
71
-
72
-
73
-
74
-
75
-
76
-
77
-
78
-
79
-
80
-
81
-
82
-
83
-
84
-
85
-
86
-
87
-
88
-
89
-
90
-
91
-
92
-
93
-
94
-
95
-
96
-
97
-
98
-
99
-
100
-
101
-
102
-
103
-
104
-
105
-
106
-
107
-
108
-
109
-
110
-
111
-
112
-
113
-
114
-
115
-
 116
116 -
 117
117 -
 118
118 -
 119
119 -
 120
120 -
 121
121 -
 122
122 -
 123
123 -
 124
124 -
 125
125 -
 126
126 -
 127
127 -
 128
128 -
 129
129 -
 130
130 -
 131
131 -
 132
132 -
 133
133 -
 134
134 -
 135
135 -
 136
136 -
137
-
138
-
139
-
140
-
141
-
142
-
143
-
144
-
145
-
146
-
147
-
148
-
149
-
150
-
151
-
152
-
153
-
154
-
155
-
156
-
157
-
158
-
159
-
160
-
161
-
162
-
163
-
164
-
165
-
166
-
167
-
168
-
169
-
170
-
171
-
172
-
173
-
174
-
175
-
176
-
177
-
178
-
179
-
180
-
181
-
182
-
183
-
184
-
185
-
186
-
187
-
188
-
189
-
190
-
191
-
192
-
193
-
194
-
195
-
196
-
197
-
198
-
199
-
200
-
201
-
202
-
203
-
204
-
205
-
206
-
207
-
208
-
209
-
210
-
211
-
212
-
213
-
214
-
215
-
216
-
217
-
218
-
219
-
220
-
221
-
222
-
223
-
224
-
225
-
226
-
227
-
228
-
229
-
230
-
231
-
232
-
233
-
234
-
235
-
236
-
237
-
238
-
239
-
240
-
241
-
242
-
243
-
244
-
245
-
246
-
247
-
248
-
249
-
250
-
251
-
252
-
253
-
254
-
255
-
256
-
257
-
258
-
259
 |
 |

108
PART II
DUKE ENERGY CORPORATION • DUKE ENERGY CAROLINAS, LLC • PROGRESS ENERGY, INC. •
DUKE ENERGY PROGRESS, INC. • DUKE ENERGY FLORIDA, INC. • DUKE ENERGY OHIO, INC. • DUKE ENERGY INDIANA, INC.
Combined Notes to Consolidated Financial Statements – (Continued)
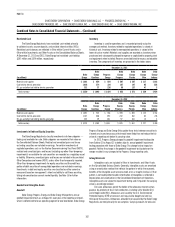
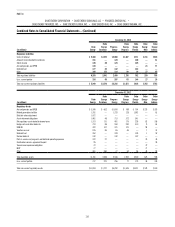
Accounting Charges Related to the Merger Consummation
The following pretax consummation charges were recognized upon closing
of the merger and are included in the Duke Energy Registrants’ Consolidated
Statements of Operations and Comprehensive Income for the year ended
December 31, 2012.
(in millions)
Duke
Energy
Duke
Energy
Carolinas
Progress
Energy
Duke
Energy
Progress
Duke
Energy
Florida
Duke
Energy
Ohio
Duke
Energy
Indiana
FERC Mitigation $117 $46 $71 $71 $— $— $—
Severance costs 196 63 82 55 27 21 18
Community support, charitable contributions and other 169 79 74 63 11 7 6
Total $482 $188 $227 $ 189 $ 38 $ 28 $ 24
FERC Mitigation charges reect the portion of transmission project costs
probable of disallowance, impairment of the carrying value of the generation
assets serving Interim FERC Mitigation, and mark-to-market losses recognized
on power sale agreements upon closing of the merger. Charges related to
transmission projects and impairment of the carrying value of generation assets
were recorded within Impairment charges in the Consolidated Statements
of Operations. Mark-to-market losses on interim power sale agreements
was recorded in Regulated electric operating revenues in the Consolidated
Statements of Operations. Subsequent changes in fair value of interim
power sale agreements over the life of the contracts and realized gains or
losses on interim contract sales are also recorded within Regulated electric
operating revenues. The ability to successfully defend future recovery of a
portion of transmission projects in rates and any future changes to estimated
transmission project costs could impact the amount not expected to be
recovered.
In conjunction with the merger, in November 2011, Duke Energy and
Progress Energy each offered a voluntary severance plan (VSP) to certain eligible
employees. VSP and other severance costs incurred were recorded primarily
within Operation, maintenance and other in the Consolidated Statements of
Operations. See Note 19 for further information related to employee severance
expenses.
Community support, charitable contributions and other reect (i) the
unconditional obligation to provide funding at a level comparable to historic
practices over the next four years, and (ii) nancial and legal advisory costs
incurred upon the closing of the merger, retention and relocation costs paid to
certain employees. These charges were recorded within Operation, maintenance
and other in the Consolidated Statements of Operations.
Impact of Merger
The impact of Progress Energy on Duke Energy’s revenues and net income
attributable to Duke Energy in the Consolidated Statements of Operations for
the year ended December 31, 2012 was an increase of $4,943 million and
$368 million, respectively.
Chilean Operations
In December 2012, Duke Energy acquired Iberoamericana de Energía
Ibener, S.A. (Ibener) of Santiago, Chile for cash consideration of $415 million.
This acquisition included the 140 Megawatt (MW) Duqueco hydroelectric
generation complex consisting of two run-of-the-river plants located in southern
Chile. Purchase price allocation consisted primarily of $383 million of property,
plant and equipment, $30 million of intangible assets, $57 million of deferred
income tax liabilities, $54 million of goodwill and $8 million of working capital.
In connection with the acquisition, a $190 million six-month bridge loan and
a $200 million revolving loan under a credit agreement were executed with a
commercial bank. Both loans were fully collateralized with cash deposits, and
therefore no net proceeds from the nancings existed as of December 31, 2012.
The $190 million bridge loan was classied in Current maturities of long-term
debt and the related cash collateral deposit was classied as Current Assets
on the Consolidated Balance Sheets as of December 31, 2012. The revolving
loan is classied as Long-term Debt and the related cash collateral deposit is
classied as Investments and Other Assets on the Consolidated Balance Sheets.
In April 2013, the six-month bridge loan executed in connection with the
acquisition was replaced with a nonrecourse secured credit facility with a term
of thirteen years, and the cash collateral related to the six-month bridge loan
was returned to Duke Energy. See Note 6 for additional discussion related to the
bridge loan conversion.
Midwest Generation Exit
On February 17, 2014, Duke Energy Ohio announced that it had initiated
a process to exit its nonregulated Midwest generation business. Considering
a marketing period of several months and potential regulatory approvals,
Duke Energy Ohio expects to dispose of the nonregulated Midwest generation
business by early to mid-2015. In the rst quarter of 2014, Duke Energy Ohio
will reclassify approximately $3.5 billion carrying value of its Midwest generation
business to assets held for sale and expects to record an estimated pretax
impairment charge of $1 billion to $2 billion to reduce the carrying value to
estimated sales proceeds less cost to sell.
Vermillion Generating Station
On January 12, 2012, after receiving approvals from the FERC and
IURC on August 12, 2011 and December 28, 2011, respectively, Duke Energy
Vermillion II, LLC (Duke Energy Vermillion), an indirect wholly owned subsidiary
of Duke Energy Ohio, completed the sale of its ownership interest in Vermillion
Generating Station (Vermillion) to Duke Energy Indiana and Wabash Valley
Power Association (WVPA). Upon closing of the sale, Duke Energy Indiana held
a 62.5 percent interest in Vermillion. Duke Energy Ohio received net proceeds of
$82 million, of which $68 million was paid by Duke Energy Indiana. Following
the transaction, Duke Energy Indiana retired Gallagher Units 1 and 3 effective
February 1, 2012.
As Duke Energy Indiana is an afliate of Duke Energy Vermillion, the
transaction was accounted for as a transfer between entities under common
control with no gain or loss recorded and did not have a signicant impact to
Duke Energy Ohio’s or Duke Energy Indiana’s results of operations. Proceeds
received from Duke Energy Indiana are included in Net proceeds from the